 Zůstat
Obchodní podmínky
Nástroje


To open long positions on GBPUSD, you need:
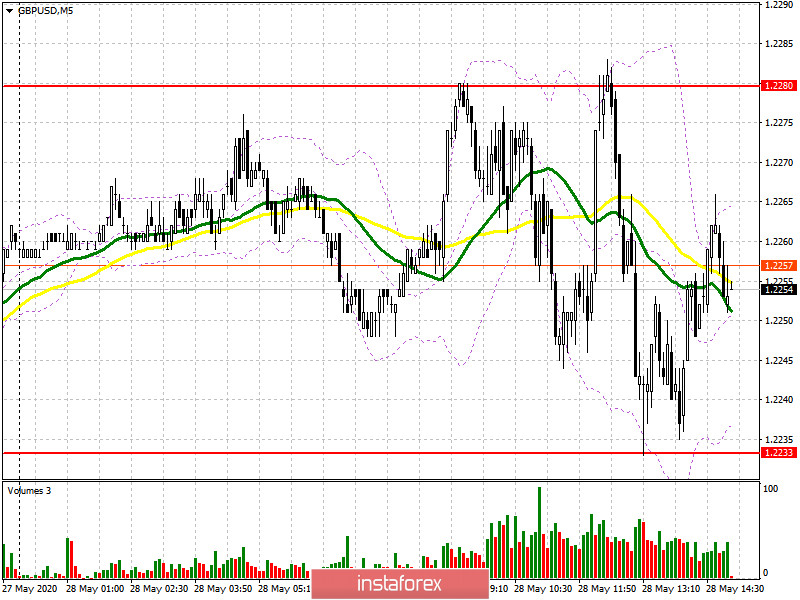
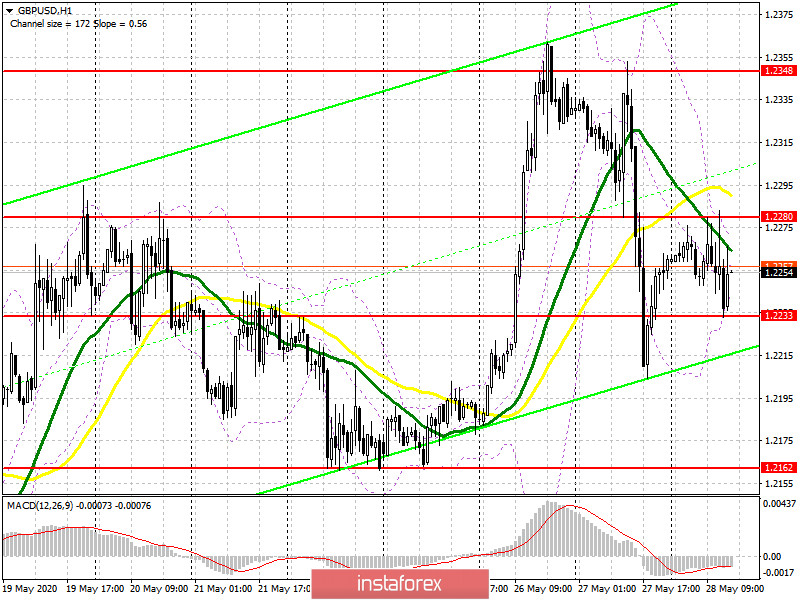
Sellers coped with the morning task, as did buyers, which kept the pair in the side channel. If you look at the 5-minute chart, you will see how the repeated resistance test of 1.2280 led to a rapid decline in the GBP/USD, which I drew attention to in my morning forecast. A similar pattern occurred in the support area of 1.2233, where a repeated test led to the formation of a buy signal, which continues to operate now. For the formation of upward momentum, the bulls in the second half of the day need a breakout and consolidation above the resistance of 1.2280, as only this will keep the hope of a recovery of the pound in the short term. The nearest target of the bulls will be this week's maximum of 1.2348, where I recommend fixing the profits. In the scenario of a decline in the pound under the support of 1.2233, and this will happen if there is good data on the state of the US economy in the 1st quarter, it is best to postpone long positions to the test of the minimum of 1.2162, from where you can open long positions immediately for a rebound in the expectation of correction of 30-40 points by the end of the day.
To open short positions on GBPUSD, you need:
The sellers' task for the second half of the day remained unchanged. Only the return of support to 1.2233 will be a signal to open short positions, which will allow you to quickly push GBP/USD to the area of lows 1.162 and 1.2122, where I recommend fixing the profits. Given that no important fundamental statistics for the UK are published today, traders will be waiting for reports on US GDP and the labor market, which will be released later in the afternoon. If the bulls again attempt to increase the pair above the resistance of 1.2280, then only another false breakout formation at this level will be a signal to sell GBP/USD. But it is best to open short positions immediately for a rebound at this week's maximum of 1.2345, or even higher, from the level of 1.2425 with the aim of a small downward correction at the end of the day of 30-40 points.
Signals of indicators:
Moving averages
Trading is conducted in the area of 30 and 50 daily averages, which indicates an active confrontation between buyers and sellers.
Note: The period and prices of moving averages are considered by the author on the hourly chart H1 and differ from the general definition of the classic daily moving averages on the daily chart D1.
Bollinger Bands
A break in the lower border of the indicator around 1.2233 will increase the pressure on the pair, while a rise above 1.2280 will lead to a larger upward trend.
Description of indicators
Díky analytickým přehledům společnosti InstaForex získáte plné povědomi o tržních trendech! Jako zákazníkovi společnosti InstaForex je Vám k dispozici velký počet bezplatných služeb umožňujících efektivní obchodování.

