 Zůstat
Obchodní podmínky
Nástroje


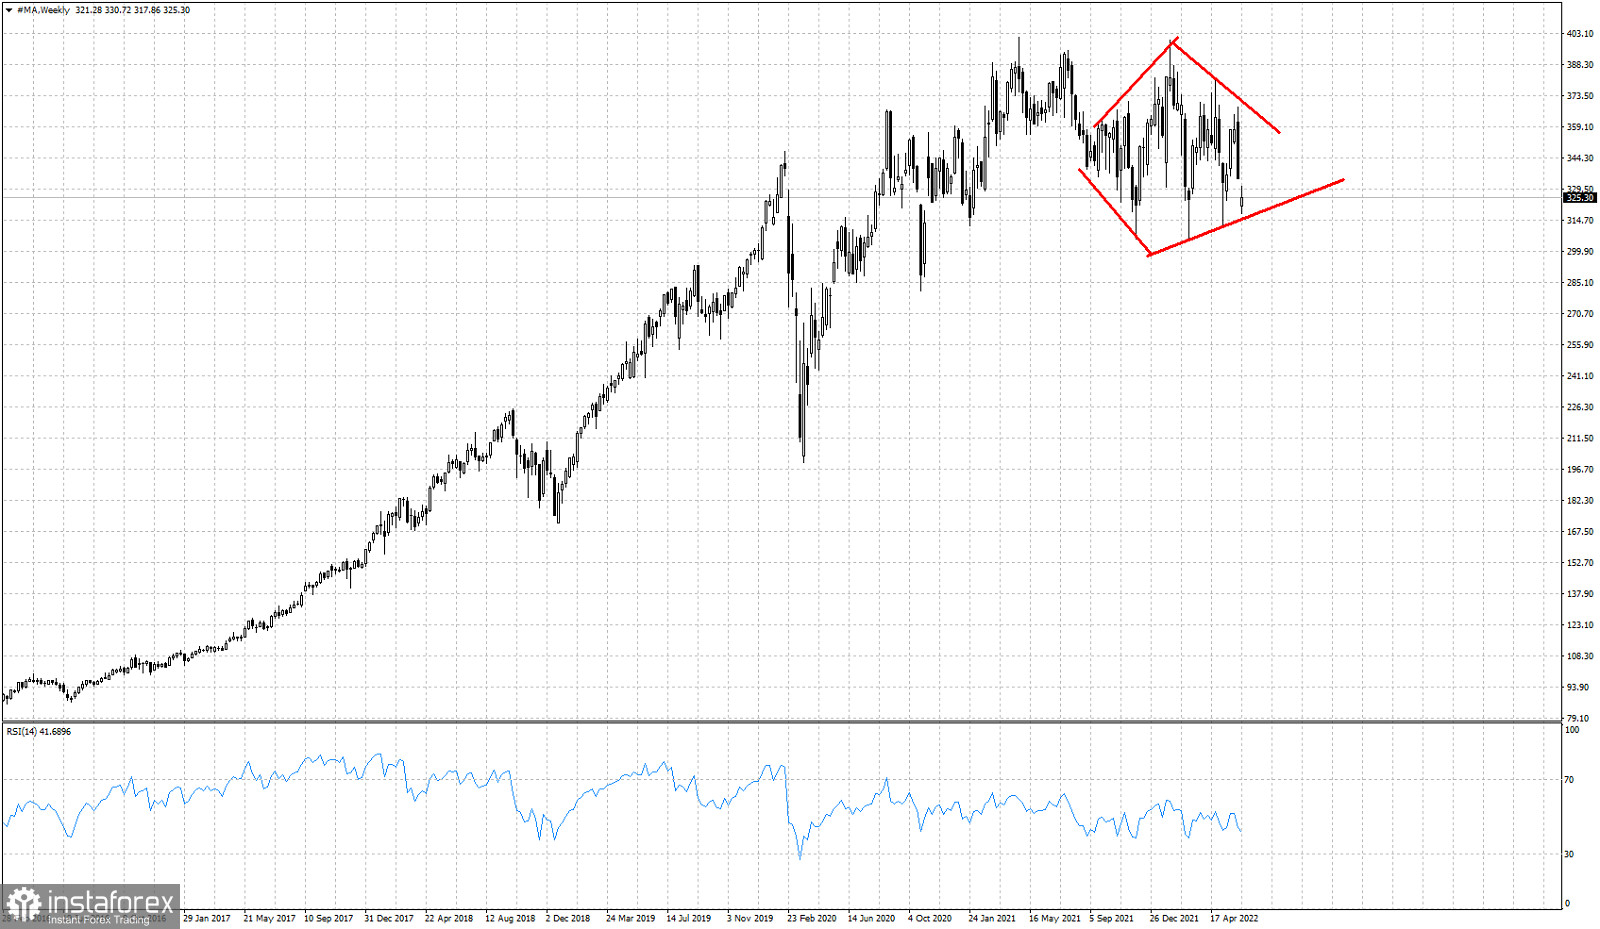
Red lines- diamond pattern boundaries
In the weekly chart of MA stock price we have identified a price pattern that if met near the highs of a trend, usually indicates increased chances of a bearish reversal. In MA weekly price chart we have identified a bearish diamond pattern. Price is now challenging the lower boundary of the pattern. Support is found at $314. There are increased chances, if support is respected, for price to bounce higher towards the upper boundary resistance at $362. Failure to hold above $314, will be a bearish signal and activation of the bearish pattern. Price will then be expected to decline towards $220-$240 area.
Díky analytickým přehledům společnosti InstaForex získáte plné povědomi o tržních trendech! Jako zákazníkovi společnosti InstaForex je Vám k dispozici velký počet bezplatných služeb umožňujících efektivní obchodování.
Your IP address shows that you are currently located in the USA. If you are a resident of the United States, you are prohibited from using the services of Instant Trading EU Ltd including online trading, online transfers, deposit/withdrawal of funds, etc.
If you think you are seeing this message by mistake and your location is not the US, kindly proceed to the website. Otherwise, you must leave the website in order to comply with government restrictions.
Why does your IP address show your location as the USA?
Please confirm whether you are a US resident or not by clicking the relevant button below. If you choose the wrong option, being a US resident, you will not be able to open an account with InstaForex anyway.
We are sorry for any inconvenience caused by this message.


