 Zůstat
Obchodní podmínky
Nástroje


EUR/USD 5M
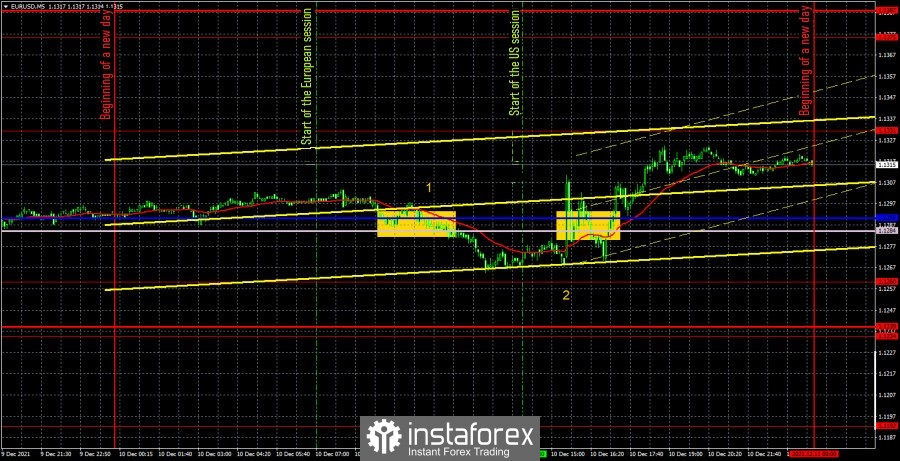
The EUR/USD pair did not trade in the best way during the last trading day of the week. Of course, the report on inflation in the US, which we talked about all last week, had a huge impact on the mood of the markets. After its release, the quotes of the euro currency rose by 40 points in five minutes, and then fell by exactly the same amount over the next hour. Thus, we can conclude that the markets did not quite logically work out the inflation report. It would be much more logical if the US currency eventually rose in price. But instead, the euro gained, which continues to adjust with difficulty against the dollar. Also, European Central Bank President Christine Lagarde gave a speech (the figure "1" in the chart) on Friday, but no new information was received. Therefore, it remains only to analyze the trading signals and understand how to trade on Friday. The first sell signal was formed when the price overcame the Kijun-sen and Senkou Span B lines in the European session. After that, with great difficulty, the price went down 15 points, so traders had the opportunity to set a Stop Loss at breakeven on a short position. Then the "storm" began when the US inflation report was released and the pair began to fly from side to side, breaking both lines of the Ichimoku indicator several times. Thus, it was not necessary to work out all these signals. Firstly, they were formed immediately after the most important report. Secondly, when the market calmed down a bit, it became clear that all these signals were false, so it was no longer necessary to work out similar signals near these lines. As a result, only one transaction was opened, which closed at breakeven.
EUR/USD 1H
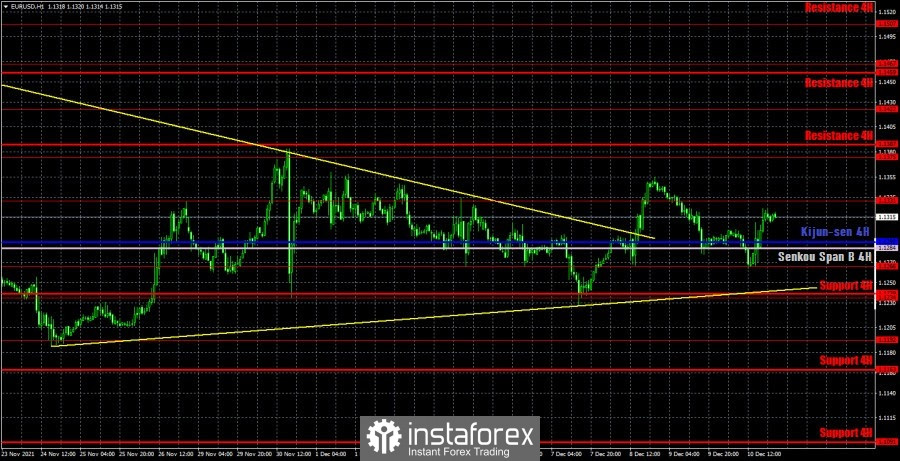
On the hourly timeframe, the pair continues to move upwards with great difficulty and a rising trend line has been formed. The pair tried to settle below the important Senkou Span B line last Friday, but without success, so the weak upward trend persists. We highlight the following levels for trading on Monday – 1.1192, 1.1234, 1.1266, 1.1331, 1.1375, as well as the Senkou Span B (1.1284) and Kijun-sen (1.1290) lines. The lines of the Ichimoku indicator may change their position during the day, which should be taken into account when searching for trading signals. Signals can be rebounds or breakthroughs of these levels and lines. Do not forget about placing a Stop Loss order at breakeven if the price moves 15 points in the right direction. This will protect you against possible losses if the signal turns out to be false. Not a single important event planned in the European Union and in the United States on December 13. However, the markets can already trade with an eye on Wednesday and Thursday, when the results of the ECB and Federal Reserve meetings will be announced. Most likely, the pair will trade as calmly as possible with a slight upward bias on Monday and Tuesday. It is unlikely that the markets will force events and take risks until Wednesday evening.
We recommend you to familiarize yourself:
Overview of the EUR/USD pair. December 13. The markets have been lying low for a week and are waiting for the outcome of the Fed meeting.
Overview of the GBP/USD pair. December 13. The market does not believe that the Bank of England will raise the rate.
Forecast and trading signals for GBP/USD for December 13. Detailed analysis of the movement of the pair and trade deals.
Analysis of the COT report
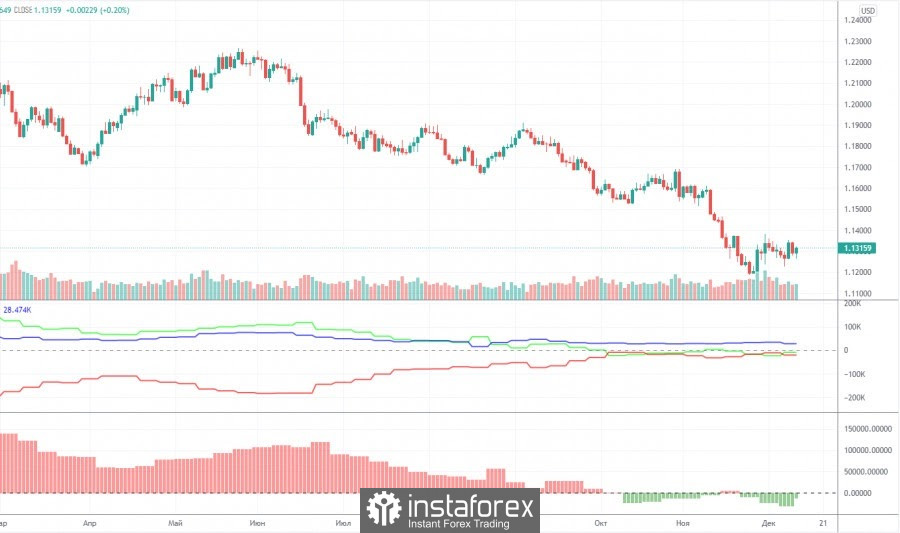
The mood of non-commercial traders became... less bearish again during the last reporting week (November 30 – December 6). What does it mean? This means that the group of "non-commercial" traders now has more open short positions than long ones, but at the same time, the number of sell contracts (shorts) has decreased over the past week. To be precise, it decreased by 15,000, and the number of longs increased by 2,000. Thus, the net position of professional players increased by 17,000, respectively, the bearish mood became less strong. However, it was not strong, and the trend is important to us first of all. And that's just with the trend lately, everything is bad... The fact is (and it is perfectly noticeable in the chart above) that the green and red lines (net positions of non-commercial and commercial traders) have been tightly stuck near the zero level in recent months. This means that now the mood of both groups of traders is as neutral as possible. Nevertheless, all this time the European currency continues to fall, which already looks like a correlation between the actions of major market participants and the movement of the euro exchange rate. So far, this can be attributed to chance, but the bearish mood in the euro has not intensified in recent weeks and months. Thus, it is impossible to say that major players continue to get rid of the euro currency. From this point of view, it can be assumed that the downward trend is nearing its end, but at the same time you should wait for strong technical signals to start opening long positions.
Explanations for the chart:
Support and Resistance Levels are the levels that serve as targets when buying or selling the pair. You can place Take Profit near these levels.
Kijun-sen and Senkou Span B lines are lines of the Ichimoku indicator transferred to the hourly timeframe from the 4-hour one.
Support and resistance areas are areas from which the price has repeatedly rebounded off.
Yellow lines are trend lines, trend channels and any other technical patterns.
Indicator 1 on the COT charts is the size of the net position of each category of traders.
Indicator 2 on the COT charts is the size of the net position for the non-commercial group.
Díky analytickým přehledům společnosti InstaForex získáte plné povědomi o tržních trendech! Jako zákazníkovi společnosti InstaForex je Vám k dispozici velký počet bezplatných služeb umožňujících efektivní obchodování.


