 Zůstat
Obchodní podmínky
Nástroje


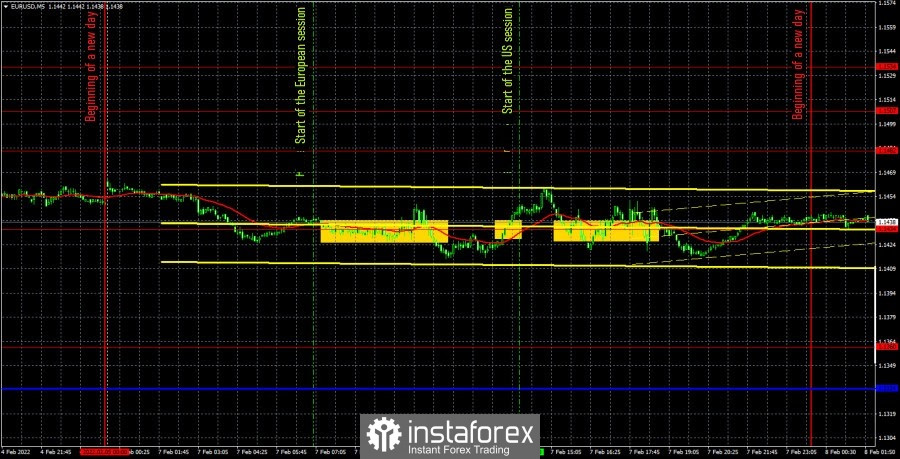
The EUR/USD pair traded in an outright flat on Monday. The price has been circling around the 1.1434 level all day and crossed it about ten times in total. Thus, it was simply impossible to trade with such a movement. The pair spent the entire Monday inside a narrow horizontal channel, which was quite expected, since the "foundation" and "macroeconomics" were absent today. Thus, we get an ultra-boring Monday, when absolutely nothing interesting happens either in macroeconomic terms, or in fundamental or technical terms. Moreover, Tuesday and Wednesday this week may be no better, since nothing interesting is planned for these days either in the United States or in the European Union.
As for trading signals and transactions on them. The most important thing on Monday was to identify the flat in time. This is not so easy to do, since a flat in the morning does not mean that it will persist all day. However, yesterday, the pair spent the first three hours of the European trading session in such a flat, which did not even cause any doubts. At this time, traders had to assume that the pair could be in a narrow horizontal channel during the day. Then the price began to move a little more actively, but never managed to move away from the morning channel by more than 20 points. Traders could open a maximum of two trades today if the flat was not identified by them. Naturally, both are unprofitable. However, there was still no big loss, as the volatility of the pair left much to be desired yesterday.
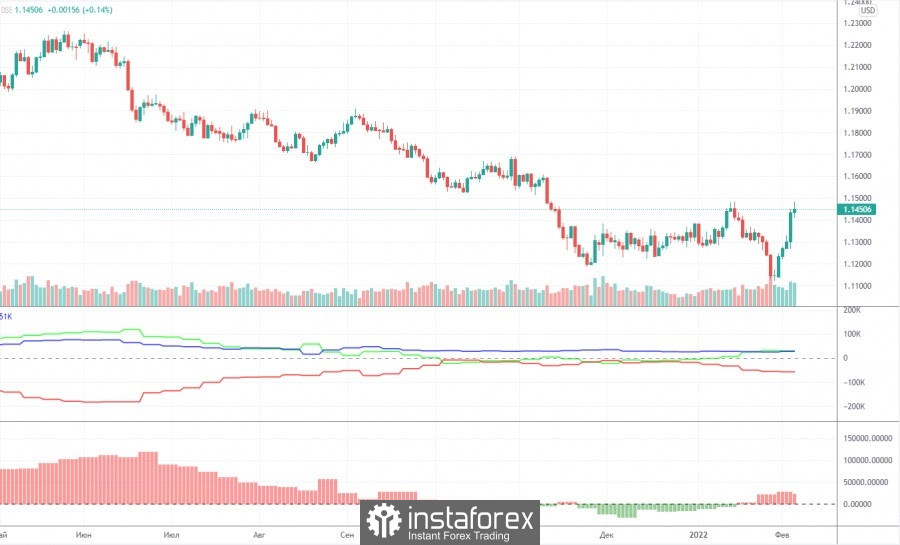
The new Commitment of Traders (COT) report, which was released on Friday, showed an increase in bullish sentiment among a group of professional traders ("non-commercial"). As you can see in the chart above, the green line indicating the "non-commercial" net position continues to be above zero, although in fact it has slightly decreased following the results of the last COT report. However, there is nothing to be surprised about, since Thursday, when the European Central Bank summed up the results of the meeting, and traders were being active, did not get into the latest report. Thus, even without data on Wednesday, Thursday and Friday, we see that the major players are slowly starting to buy the euro currency, and do not continue to sell it. The red and green lines of the first indicator were near the zero level for a long time, which signaled the end of the last trend. And the past trend is the downward trend of 2021. Given that market participants completely ignored the fundamental background of last week, we conclude that the time for long positions on the dollar and short positions on the euro has come to an end. The "sharp start" of the euro also speaks in favor of the beginning of a new upward trend. The EU currency has grown almost out of the blue by 300 points in five days. This is how most trends begin. Of course, nothing prevents traders from winning back this injustice in the new week. Still, the pair should be adjusted from time to time, even if the fundamental background does not speak in favor of this. But for now, we consider this scenario to be an alternative scenario.
Overview of the EUR/USD pair. February 8. Christine Lagarde still refuses to acknowledge the problem of high inflation.
Overview of the GBP/USD pair. February 8. Boris Johnson has decided to purge the ranks in order to avoid a looming vote of no confidence.
Forecast and trading signals for GBP/USD on February 8. Detailed analysis of the movement of the pair
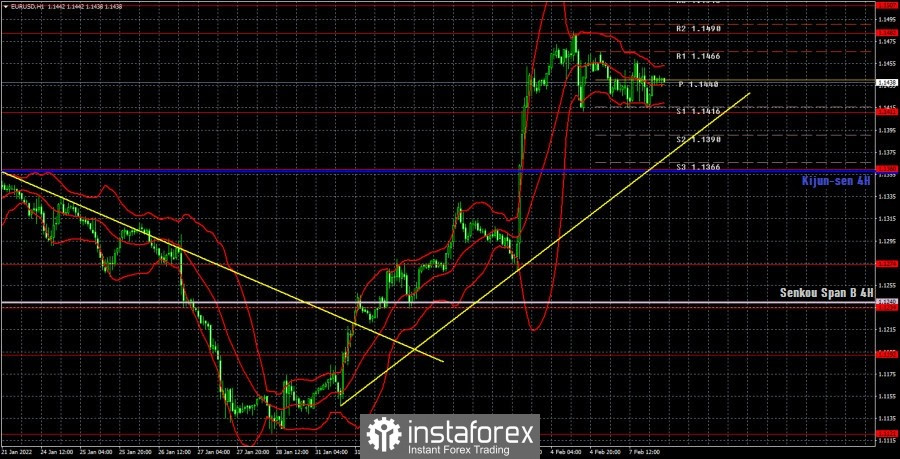
The euro/dollar pair maintains an upward trend on the hourly timeframe, as evidenced by the ascending trend line. Strictly speaking, it would be very good to see a correction to this trend line now, but Monday was held flat. Unfortunately, a similar pattern can be observed on Tuesday and Wednesday. On Tuesday, we allocate the following levels for trading – 1.1274, 1.1360, 1.1411, 1.1482, 1.1507, 1.1534, as well as the Senkou Span B (1.1240) and Kijun-sen (1.1358) lines. There are also auxiliary support and resistance levels, but no signals will be formed near them. The lines of the Ichimoku indicator may change their position during the day, which should be taken into account when searching for trading signals. Signals can be "bounces" and "breakthroughs" levels - extremes and lines. Do not forget about placing a Stop Loss order at breakeven if the price went in the right direction of 15 points. This will protect you against possible losses if the signal turns out to be false. No important events or publications are planned in the United States and the European Union on February 8 again. Therefore, today you will have to trade on pure "technique". We believe that volatility will be low again, and the movement will be downward or sideways. You should be careful not to fall into the trap with a flat, as on Monday.
Support and Resistance Levels are the levels that serve as targets when buying or selling the pair. You can place Take Profit near these levels.
Kijun-sen and Senkou Span B lines are lines of the Ichimoku indicator transferred to the hourly timeframe from the 4-hour one.
Support and resistance areas are areas from which the price has repeatedly rebounded off.
Yellow lines are trend lines, trend channels and any other technical patterns.
Indicator 1 on the COT charts is the size of the net position of each category of traders.
Indicator 2 on the COT charts is the size of the net position for the non-commercial group.
Díky analytickým přehledům společnosti InstaForex získáte plné povědomi o tržních trendech! Jako zákazníkovi společnosti InstaForex je Vám k dispozici velký počet bezplatných služeb umožňujících efektivní obchodování.

