 Zůstat
Obchodní podmínky
Nástroje


The annual inflation in the US reached 7.5%, the highest since February 1982. Such an increase in consumer prices may force the Fed to raise the rate immediately by 0.5% at the next meeting, which will be held on March 15-16. With such headlines about a possible increase in the refinancing rate, all the famous media were in chaos yesterday. This information background caused strong speculative surges in the market.
Meanwhile, US data on applications for unemployment benefits have a slight reduction in volume. The news on applications remained in the shadow of the information background.
Statistics details:
The volume of initial applications for benefits decreased from 239 thousand to 223 thousand.
The volume of repeated applications for benefits remained at the level of 1,621 thousand.
Analysis of trading charts from February 10:
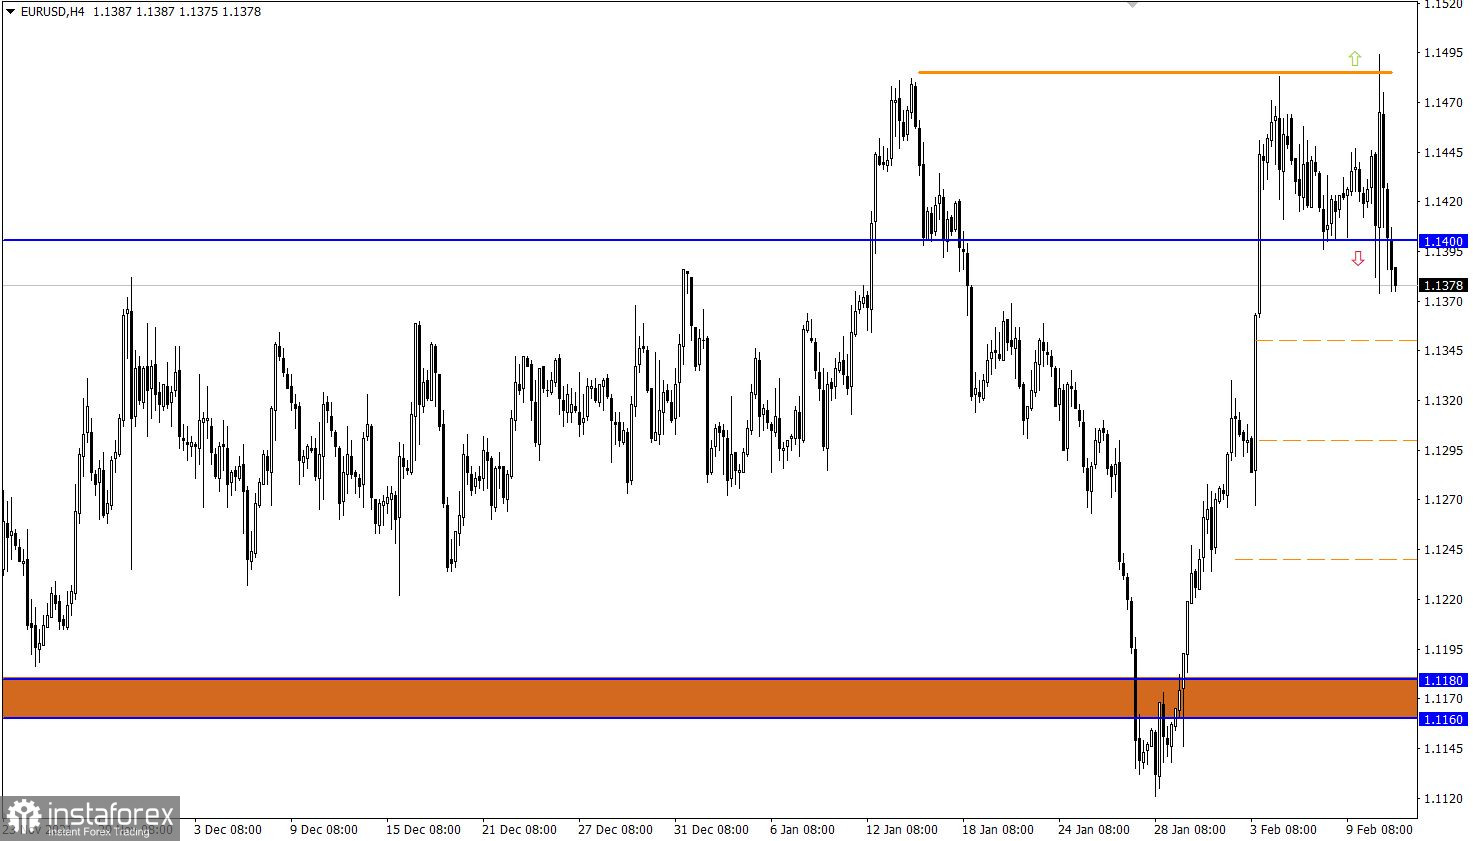
The EUR/USD pair showed strong speculative interest amid the information flow. As a result, price surges emerged in the market, which ended with the breakdown of the lower border of the side channel 1.1400/1.1480 in a four-hour period.
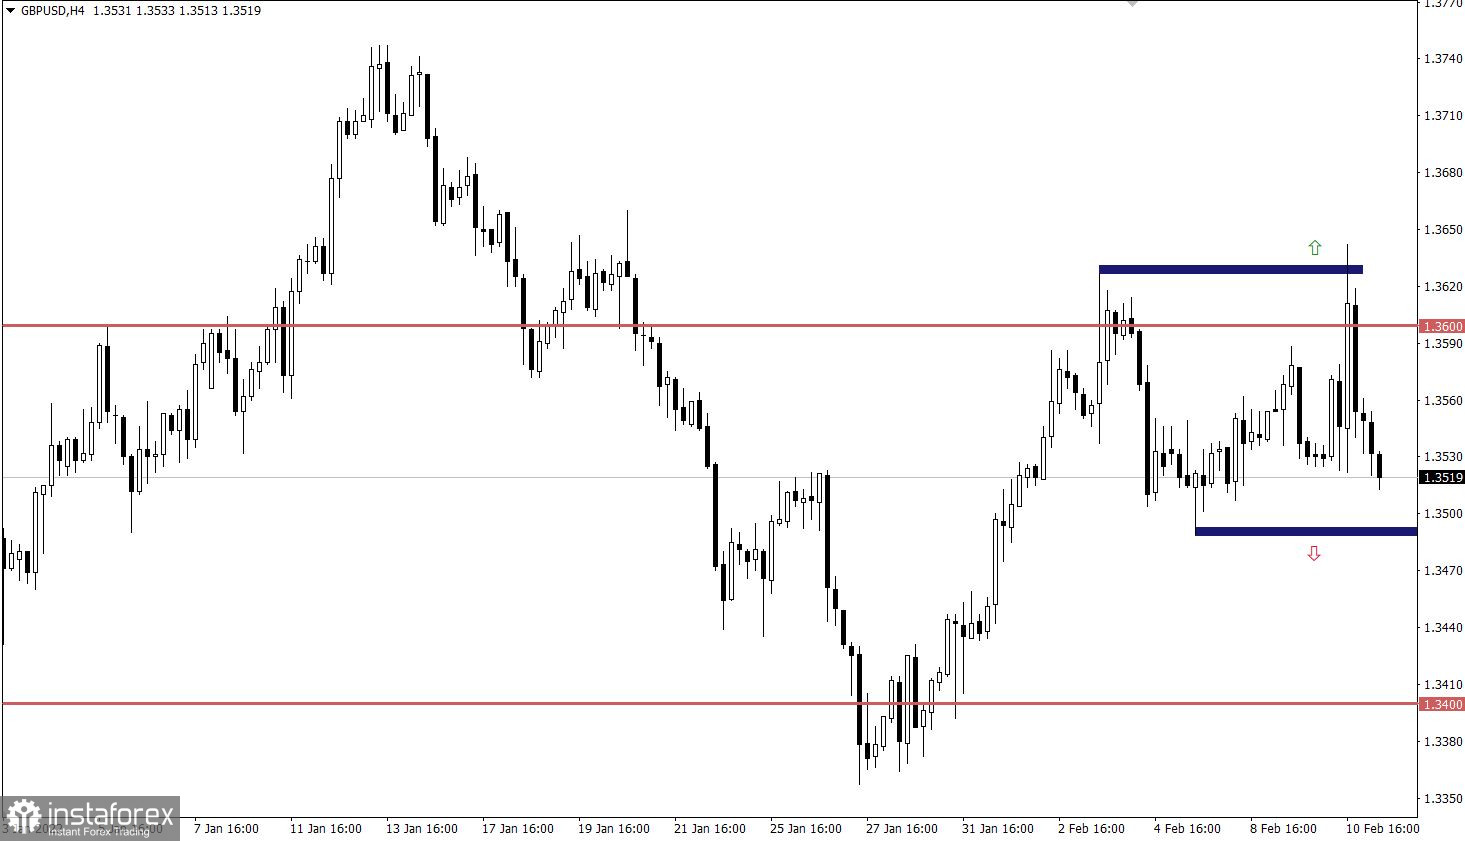
Speculation has not bypassed the British currency, so with the filing of the information background, a local high of February 3 (1.3626) appeared on the market. This step did not lead to anything drastic. The quote almost immediately returned to its original position, which is where it all started.
February 11 economic calendar:
Macroeconomic data for the UK have already been published today, which has become a cause for concern. Here, the preliminary estimate of GDP for the fourth quarter showed a slowdown in economic growth from 6.8% to 6.5%, which is not the best statistic for the pound in the medium term.
Trading plan for EUR/USD on Feb 11:
In this situation, stable price retention below the 1.1400 level increases sellers' chances of a decline, which will lead to a gradual recovery relative to the correction. Thus, the levels of 1.1350, 1.1300, 1.1240, and the area of 1.1160/1.1180 are considered in the future.
Trading plan for GBP/USD on Feb 11:
The control values of 1.3480 and 1.3630 were not confirmed in the four-hour period despite local price surges. Therefore, traders are still guided by them.
It should be noted that buy positions will be considered after holding the price above the level of 1.3630 in the H4 timeframe and sell positions will be considered after holding the price below the level of 1.3480 in the same timeframe.
Until then, the quote is in a stagnant stage, where, given the recent price changes, downward interest prevails.
What is reflected in the trading charts?
A candlestick chart view is graphical rectangles of white and black light, with sticks on top and bottom. When analyzing each candle in detail, you will see its characteristics of a relative period: the opening price, closing price, and maximum and minimum prices.
Horizontal levels are price coordinates, relative to which a stop or a price reversal may occur. These levels are called support and resistance in the market.
Circles and rectangles are highlighted examples where the price of the story unfolded. This color selection indicates horizontal lines that may put pressure on the quote in the future.
The up/down arrows are the reference points of the possible price direction in the future.
Díky analytickým přehledům společnosti InstaForex získáte plné povědomi o tržních trendech! Jako zákazníkovi společnosti InstaForex je Vám k dispozici velký počet bezplatných služeb umožňujících efektivní obchodování.


