 Zůstat
Obchodní podmínky
Nástroje


The GBP/USD currency pair on Wednesday also showed a movement close to ideal. Two important performances took place during the day, Bank of England Governor Andrew Bailey and Federal Reserve Chairman Jerome Powell, but they had virtually no impact on the pair. But the inflation report had an impact. However, not what most traders could count on. The inflation rate in the UK rose to 6.2%, which exceeded the already not very optimistic forecasts. However, instead of growth, the British currency showed a fall, which was not logical. However, we recall that a day earlier, the pound also showed an absolutely illogical growth. Therefore, we can assume that the debt has been repaid. Despite the fact that the pound/dollar pair has been growing in recent weeks, we still believe that a new fall is more likely.
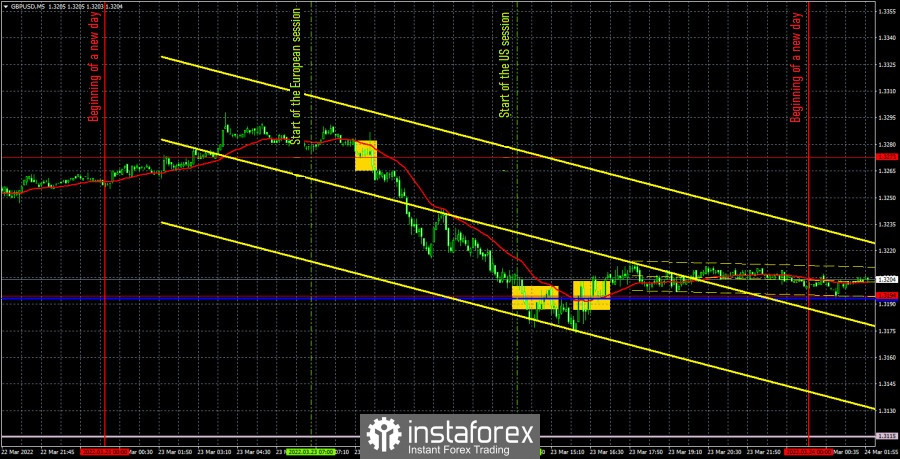
As for trading signals, they were very good. The first sell signal, which was formed at the beginning of the European session, when the price broke the level of 1.3273, turned out to be the strongest and most profitable. The price went down about 85 points after its formation and initially overcame the critical line. However, a little later, it still settled above the Kijun-sen, so the sell signal was canceled and short positions should be closed. As a result, it was possible to earn about 50-60 points and it was necessary to open long positions. However, the longs no longer brought traders any profit, as the pair was no longer able to show another strong movement. This transaction was closed manually at zero.
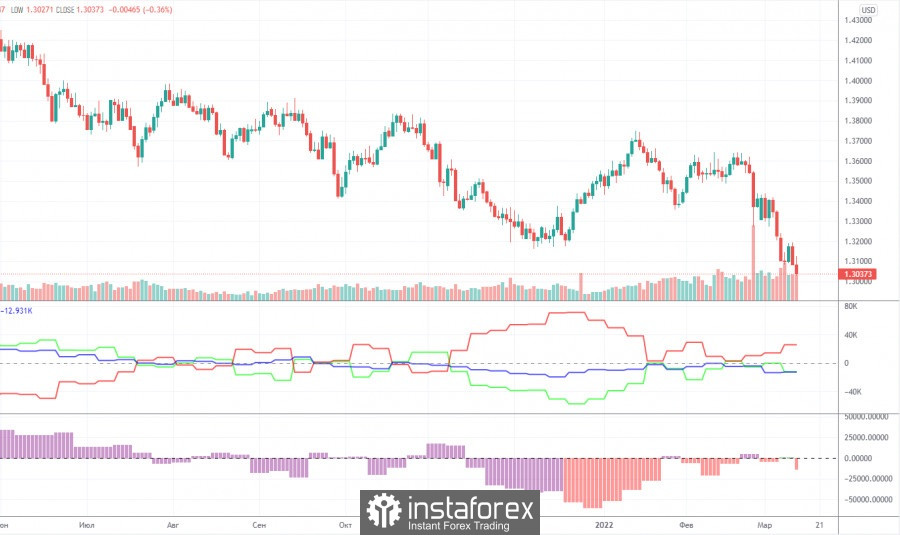
The latest Commitment of Traders (COT) report showed an increase in the bearish mood among commercial traders. However, in general, the mood of the major players has changed too often in recent months, which is clearly seen by the two indicators in the chart above: they are constantly changing the direction of their movement. At the moment, the number of open long positions is less than the number of short positions by almost 30,000. Although two weeks ago their number was almost the same. Earlier, we concluded that major players could not make a decision regarding the British pound, but we also drew attention to the fact that with the complication of the geopolitical situation, the demand for the US currency grew very much, which could "cross out" the data of COT reports. However, now the current picture of what is happening in the foreign exchange market is already beginning to correspond to the COT reports. Thus, the pound may now be at the beginning of a new round of decline. But, since in recent weeks it has only been falling, now another upward correction may follow, and then everything will depend on the geopolitical background. Like the mood of traders, the market situation can change rapidly. A month ago, few people believed that an armed conflict could break out in the center of Europe on a huge territory. Therefore, you need to be prepared for everything, and use COT reports only as an additional factor of assessment and forecasting.
Overview of the EUR/USD pair. March 24. The European currency still has nothing to cover.
Overview of the GBP/USD pair. March 24. Impressive somersaults of the British pound and two traps for traders at once.
Forecast and trading signals for EUR/USD on March 24. Detailed analysis of the movement of the pair and trading transactions.
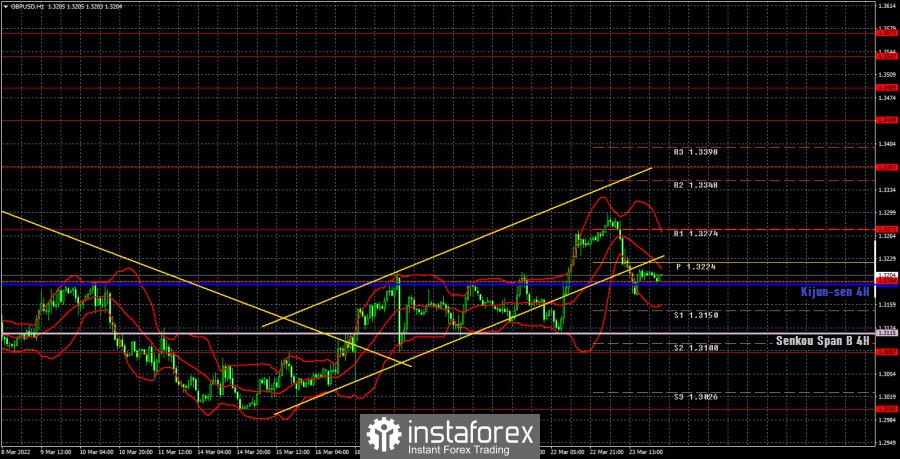
The technical picture looks very strange on the hourly timeframe. The pair has already settled below the ascending channel twice, so it is unlikely that both breakouts can be considered false. Consequently, we can expect a new fall in the British pound, but so far the price has not managed to confidently overcome the critical line, so maybe we will see a new round of growth. The pound is rising quite hard, a lot now depends on the critical line on the 24-hour TF. On March 24, we highlight the following important levels: 1.3087, 1.3194, 1.3273, 1.3367. The Senkou Span B (1.3115) and Kijun-sen (1.3190) lines can also be signal sources. Signals can be "bounces" and "breakthroughs" of these levels and lines. It is recommended to set the Stop Loss level to breakeven when the price passes in the right direction by 20 points. The lines of the Ichimoku indicator can move during the day, which should be taken into account when determining trading signals. There are also support and resistance levels on the chart that can be used to take profits on transactions. No important events are scheduled for Thursday in the UK and the United States, so it will be even more difficult for the pair to decide on the direction of movement. There may be a drop in volatility and not quite clear movements during the day. You need to be ready for this.
Support and Resistance Levels are the levels that serve as targets when buying or selling the pair. You can place Take Profit near these levels.
Kijun-sen and Senkou Span B lines are lines of the Ichimoku indicator transferred to the hourly timeframe from the 4-hour one.
Support and resistance areas are areas from which the price has repeatedly rebounded off.
Yellow lines are trend lines, trend channels and any other technical patterns.
Indicator 1 on the COT charts is the size of the net position of each category of traders.
Indicator 2 on the COT charts is the size of the net position for the non-commercial group.
Díky analytickým přehledům společnosti InstaForex získáte plné povědomi o tržních trendech! Jako zákazníkovi společnosti InstaForex je Vám k dispozici velký počet bezplatných služeb umožňujících efektivní obchodování.

