 Zůstat
Obchodní podmínky
Nástroje


Monday was traditionally accompanied by an empty macroeconomic calendar, however, the information flow played on speculators' deals. Yesterday, some American media sources began to disseminate information that many traders are demanding that the ECB immediately begin to tighten monetary policy and raise the interest rate at least four times by the end of this year. The news is ambiguous and even doubtful, but it supported the euro exchange rate in the market.
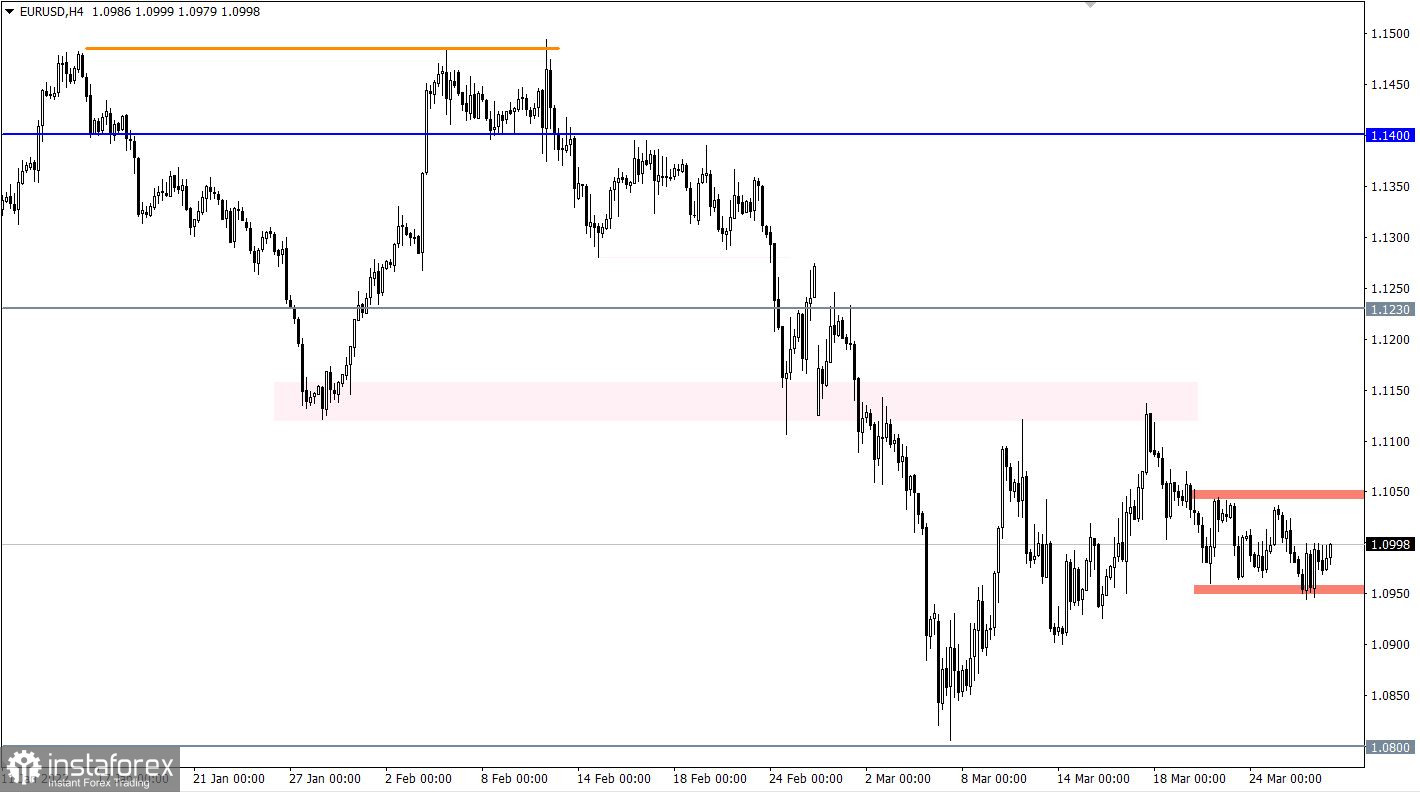
The EURUSD currency pair returned to its original position after an unsuccessful attempt to break through the lower boundary of the 1.0960/1.1050 side range. This indicates a characteristic uncertainty among traders who are still in the process of accumulating trading forces.
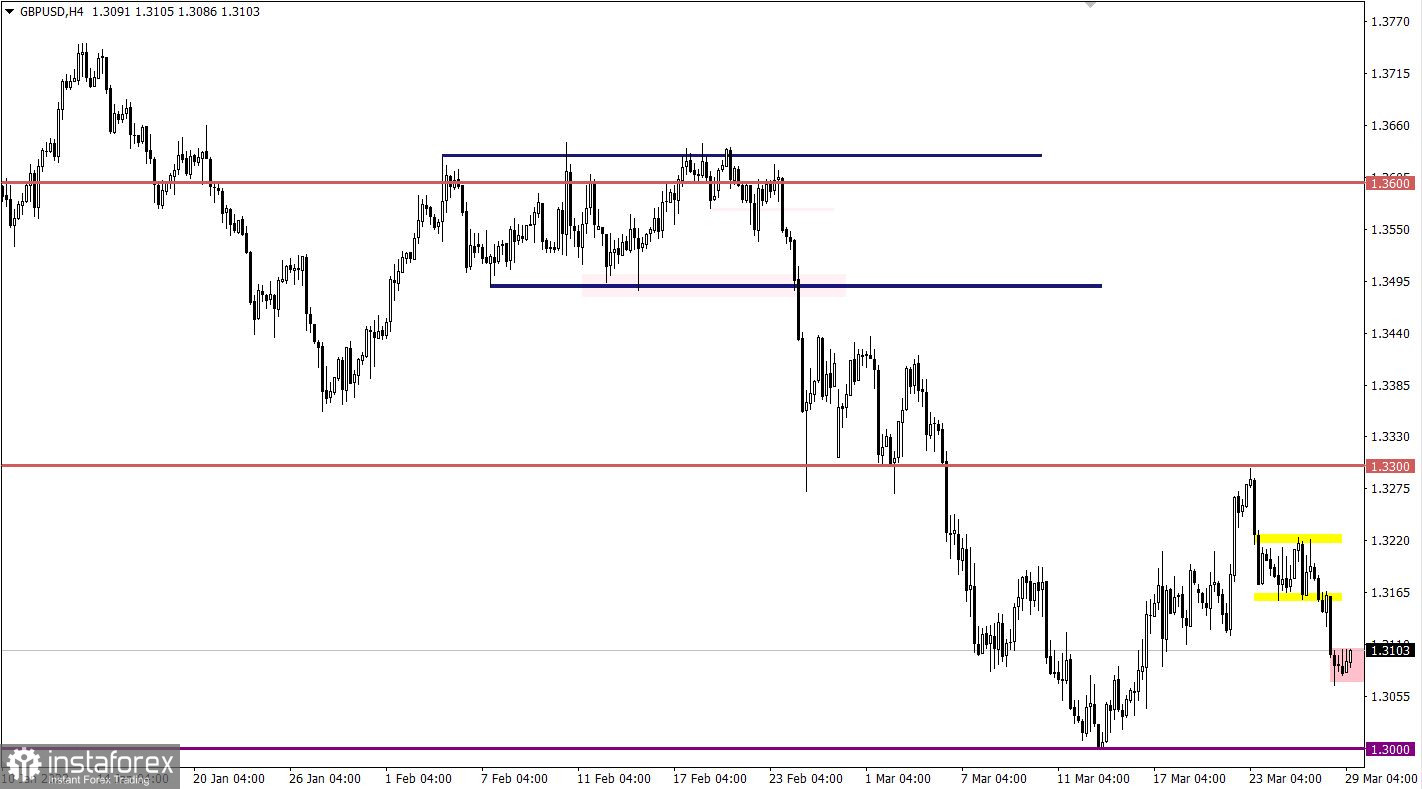
The price stagnation in the area of 1.3175/1.3220 positively affected the volume of short positions. The new trading week was opened with a downward move, where the pound sterling lost about 100 points of value. As a result, the quote fell below 1.3100.

Data on the UK lending market will be published today, where a decrease in mortgage and private lending is expected. Nevertheless, an increase in consumer lending is possible, but in general terms, the indicators are not the most favorable. These statistics may negatively affect the pound sterling.
During the American trading session, the report on Job Openings and Labor Turnover Survey in the United States will be published, which is likely to decrease. This indicates a deterioration of the situation in the labor market, which is regarded by the market as a negative factor.
Time targeting
UK lending market - 08:30 Universal time
Open vacancies in U.S. JOLTS - 14:00 Universal time
In this situation, the side range 1.0960/1.1050 focuses all the attention of market participants. There is no sign of its completion. This means that the breakout strategy is still relevant in the market. Price stagnation can become a lever for new speculation in the market.
A strong price change during the past day led to a local oversold of the British currency in the short term. This is expressed on the chart as a price stagnation of 1.3075/1.3105. A signal about the prolongation of the downward cycle will occur at the moment when the price is kept below 1.3066, which will lead to a movement towards the support point of 1.3000.
An alternative scenario allows for a transition from the stagnation stage to a local pullback in case the price is kept above the value of 1.3110.
A candlestick chart view is graphical rectangles of white and black light, with sticks on top and bottom. When analyzing each candle in detail, you will see its characteristics of a relative period: the opening price, closing price, and maximum and minimum prices.
Horizontal levels are price coordinates, relative to which a stop or a price reversal may occur. These levels are called support and resistance in the market.
Circles and rectangles are highlighted examples where the price of the story unfolded. This color selection indicates horizontal lines that may put pressure on the quote in the future.
The up/down arrows are the reference points of the possible price direction in the future.
Díky analytickým přehledům společnosti InstaForex získáte plné povědomi o tržních trendech! Jako zákazníkovi společnosti InstaForex je Vám k dispozici velký počet bezplatných služeb umožňujících efektivní obchodování.

