 Zůstat
Obchodní podmínky
Nástroje


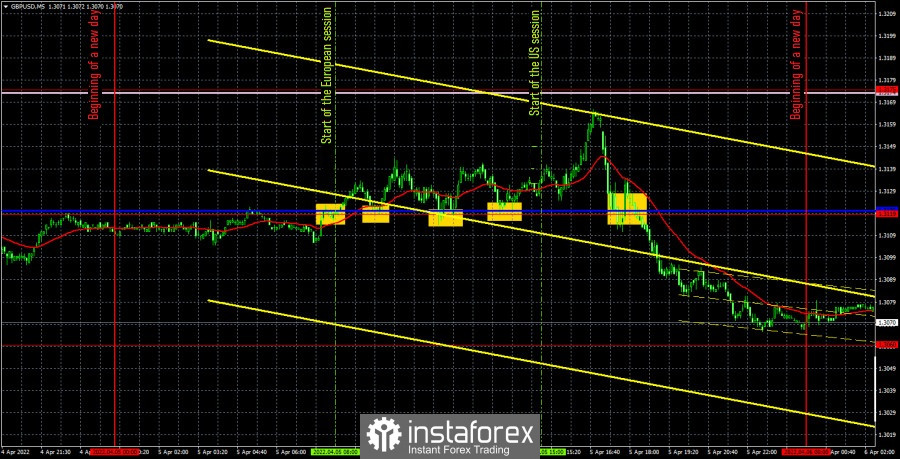
The GBP/USD currency pair tried to start an upward movement again on Tuesday, but it still fell in the afternoon. The moment when the pound started to fall coincided with the release of the ISM report in the United States. However, we very much doubt that this particular report, which, by and large, turned out to be neutral, was capable of causing a drop of 80 points. Nevertheless, theoretically, this is still possible, so we will assume that it was the ISM index in the service sector that provoked the dollar's growth, although it turned out to be worse than forecasts. It should also be noted that the pair managed to settle above the descending trend line, but at the same time, as we can see, this did not save it from a new fall. Thus, the pound's decline is still the most likely scenario for the pound/dollar pair.
There were quite a lot of trading signals on Tuesday, which is not surprising, given that the pair was flat throughout the European session. During this time, it was able to form four buy signals. Everything is near the extreme level of 1.3119 and the Kijun-sen line. The price was only able to go up more than 20 points in one case out of four. However, the long position should have been opened alone, since the price never went below 1.3119. Formally, it was possible to make a profit on this single transaction, but the pair failed to reach either the 1.3175 level or the Senkou Span B line. Therefore, there was no signal to leave the deal. The next sell signal was formed when the pair settled below the level of 1.3119 and it could also be worked out, although it was formed quite late. It was possible to earn about 20 points on it.
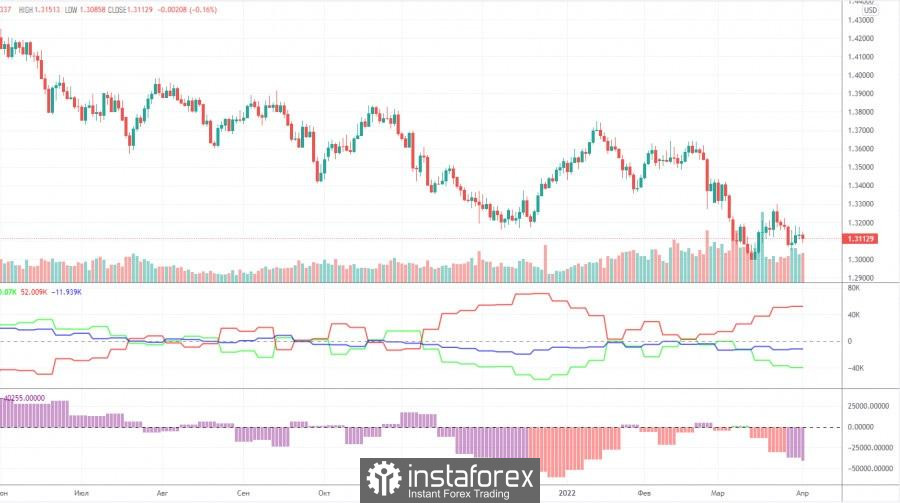
The latest Commitment of Traders (COT) report on the British pound showed minimal changes in the mood of major players. For a whole week, the non-commercial group opened only 700 short positions and closed 2,100 long positions. Thus, the net position of non-commercial traders decreased by 3,000. Even for the pound, such changes are insignificant. In general, the non-commercial group has almost 2.5 times more contracts for short positions than for longs. This means that the mood of professional traders is now "very bearish". Thus, this is another factor that speaks in favor of the continuation of the fall of the British currency. The situation with COT reports for the pound is completely different than for the euro. According to the pound, the mood of the major players changes every couple of months, and sometimes even faster. At this time, the "non-commercial" net position has already fallen to the levels where the last round of the pound's fall ended (the green line on the first indicator). Thus, we can even assume that in the coming weeks the pound will try to start a new ascent. However, much will again depend on geopolitics and technique. At the moment, the pound has a little more reason to grow than the euro. But there are plenty of factors of the fall.
Overview of the EUR/USD pair. April 6. New sanctions against Russia may be introduced today. The euro continues to fall.
Overview of the GBP/USD pair. April 6. The pound suffers from the geopolitical position of Boris Johnson.
Forecast and trading signals for EUR/USD on April 6. Detailed analysis of the movement of the pair and trading transactions.
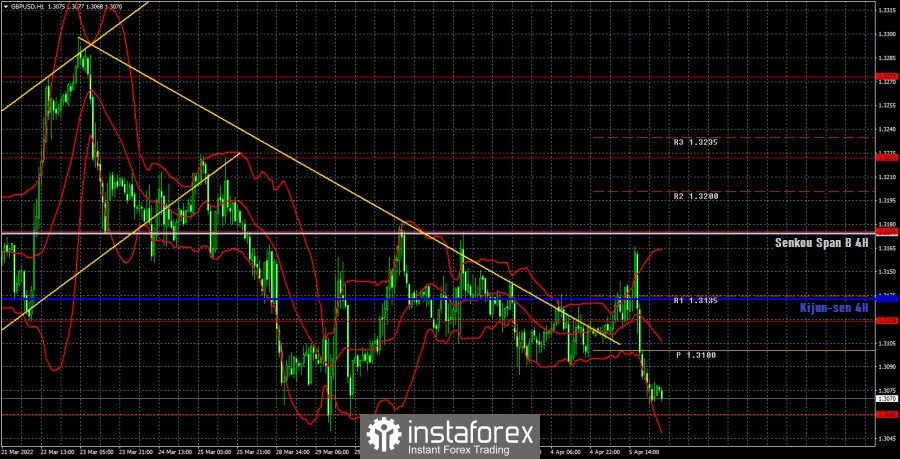
It is clearly visible on the hourly timeframe that the pair has not been able to determine the direction of movement for several weeks and has been in a limited range all this time. The upward momentum ended very quickly near the level of 1.3175 and the bulls failed to at least return to this level. As a result, in the coming hours, the pair may be near the level of 1.3060, from which it bounced a couple of weeks ago. The price could probably overcome this level this time and the pound would fall. We highlight the following important levels on April 6: 1.3000, 1.3060, 1.3119, 1.3175, 1.3222. The Senkou Span B (1.3174) and Kijun-sen (1.3133) lines can also be signal sources. Signals can be "bounces" and "breakthroughs" of these levels and lines. It is recommended to set the Stop Loss level to breakeven when the price passes in the right direction by 20 points. The lines of the Ichimoku indicator can move during the day, which should be taken into account when determining trading signals. There are also support and resistance levels on the chart that can be used to take profits on transactions. Only an absolutely secondary index of business activity in the construction sector is scheduled for Wednesday in the UK, and the Federal Reserve minutes are scheduled for late in the evening in the US. The first, or the second event is unlikely to provoke at least some reaction during the day. And by the time the minutes are published in the evening, traders are advised to leave the market already.
Support and Resistance Levels are the levels that serve as targets when buying or selling the pair. You can place Take Profit near these levels.
Kijun-sen and Senkou Span B lines are lines of the Ichimoku indicator transferred to the hourly timeframe from the 4-hour one.
Support and resistance areas are areas from which the price has repeatedly rebounded off.
Yellow lines are trend lines, trend channels and any other technical patterns.
Indicator 1 on the COT charts is the size of the net position of each category of traders.
Díky analytickým přehledům společnosti InstaForex získáte plné povědomi o tržních trendech! Jako zákazníkovi společnosti InstaForex je Vám k dispozici velký počet bezplatných služeb umožňujících efektivní obchodování.


