 Zůstat
Obchodní podmínky
Nástroje


The macroeconomic calendar was half empty, only the data on new home sales in the US was published. Sales in September fell by 10.9%—a negative factor for the country's economy, which continued to put pressure on dollar positions.
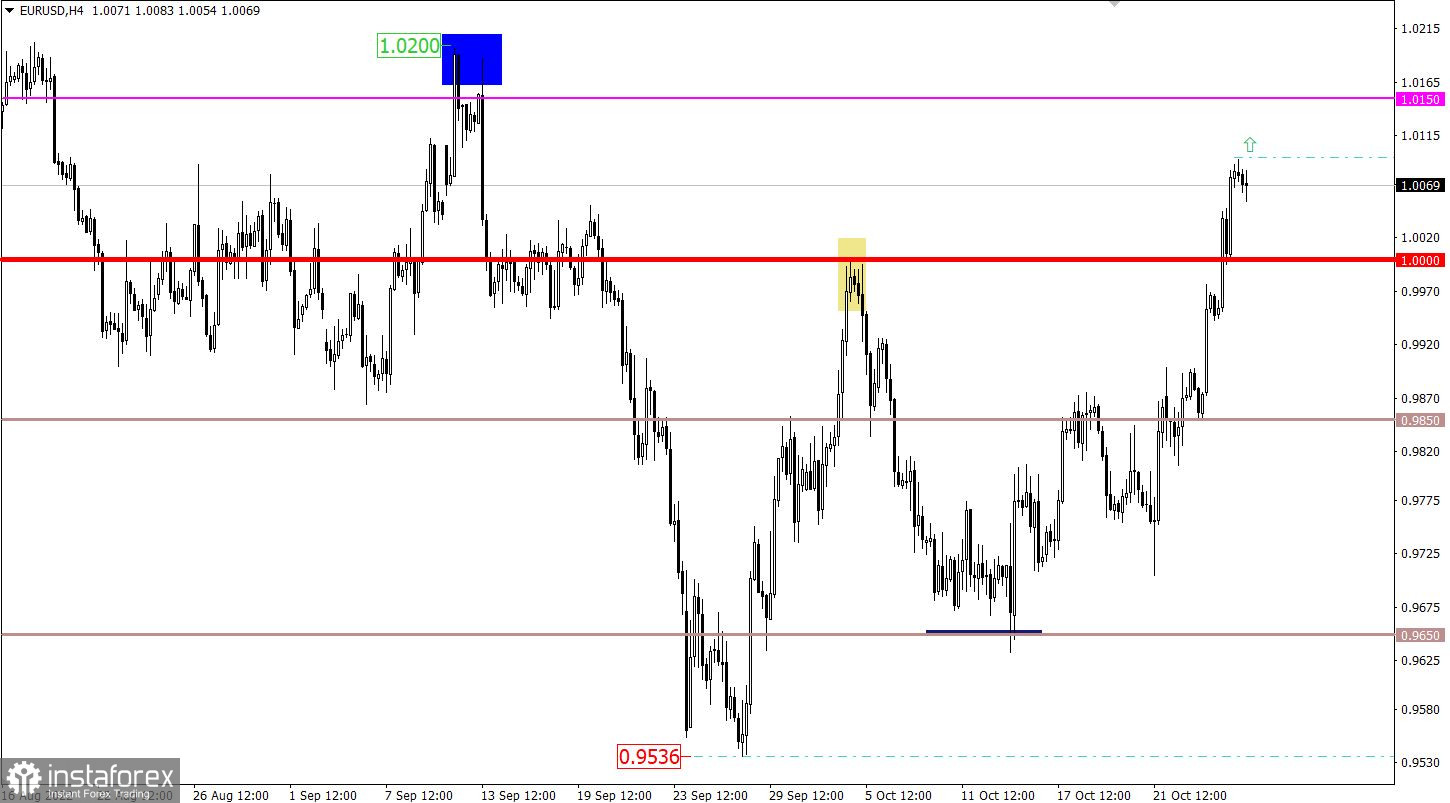
The EURUSD currency pair not only showed an upward activity, a full-fledged inertial move appeared on the market. As a result, the parity level was passed from the bottom up, and the quote turned out to be at mid-September levels. In fact, we have the prerequisites for a change in trade interests.
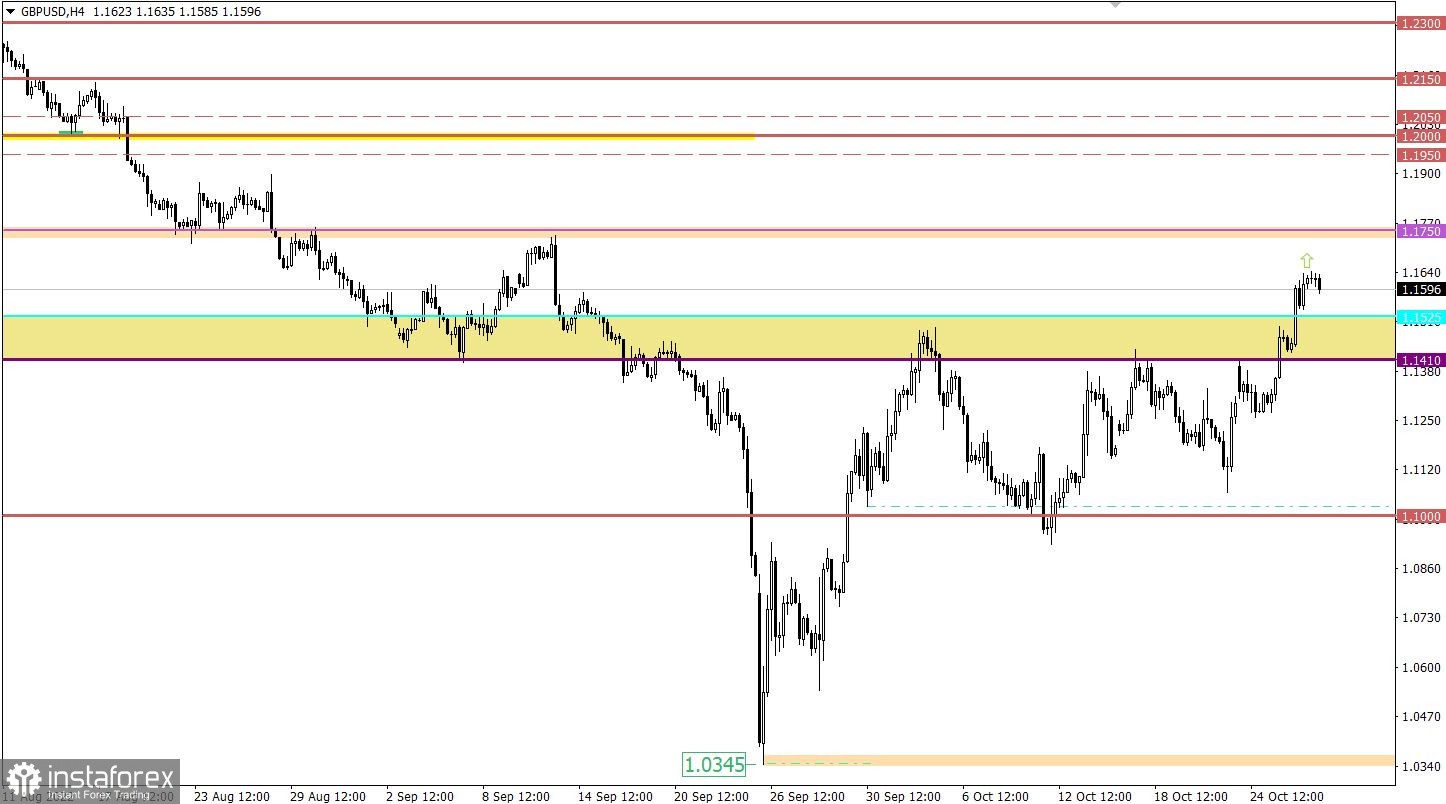
The GBPUSD currency pair overcame the resistance area of 1.1410/1.1525 during the inertial upward movement. This led to the prolongation of the current corrective move from the low of the downward trend. Taking into account the growth in the value of the pound sterling in 3.5 weeks, the exchange rate has strengthened by about 12%, which is about 1,300 points.

The key event of Thursday and the entire trading week is the ECB meeting. During which, the refinancing rate is expected to increase by 75 basis points, from 1.25% to 2.00%. The regulator may announce further interest rate hikes at the same pace.
In this case, the euro may well continue to rise, unless, of course, the ECB takes a dovish position.
In terms of statistics, the release of the first US GDP estimate for the third quarter is expected. The country's economy may grow at an annual rate of 2.1% after two quarters of contraction in the year's first half.
This is a positive factor for the country's economy, but these statistics coincide in time with the ECB meeting. For this reason, it may be left without due attention of traders.
At the same time, weekly data on US jobless claims may accelerate its growth. This is a negative factor for the US labor market.
Statistics details:
The volume of continuing claims for benefits may rise from 1.385 million to 1.388 million.
The volume of initial claims for benefits may rise from 214,000 to 220,000.
Time targeting:
ECB meeting result – 12:15 UTC
US GDP – 12:30 UTC
US Jobless Claims – 12:30 UTC
ECB press conference and commentary – 12:45 UTC
As of writing, the quote is experiencing a technical signal of euro overbought, which may lead to a pullback. In this case, the euro may again return to the control level of 1.0000.
For subsequent growth, it is necessary to stay above 1.0100. In this case, the euro overbought signal may be ignored by market participants, and the quote will rush to the local peak of September—1.0200.
In this situation, there is a clear technical signal about overheating of long positions in the pound sterling. This may lead to a slowdown in the upward cycle, which may result in a price pullback toward the previously passed resistance area.
At the same time, there are plenty of speculators in the market who can ignore the signal about the overbought pound in vain. In this case, holding the price above 1.1650 may prolong the current momentum toward the next resistance level at 1.1750.
A candlestick chart view is graphical rectangles of white and black light, with sticks on top and bottom. When analyzing each candle in detail, you will see its characteristics of a relative period: the opening price, closing price, and maximum and minimum prices.
Horizontal levels are price coordinates, relative to which a stop or a price reversal may occur. These levels are called support and resistance in the market.
Circles and rectangles are highlighted examples where the price of the story unfolded. This color selection indicates horizontal lines that may put pressure on the quote in the future.
The up/down arrows are the reference points of the possible price direction in the future.
Díky analytickým přehledům společnosti InstaForex získáte plné povědomi o tržních trendech! Jako zákazníkovi společnosti InstaForex je Vám k dispozici velký počet bezplatných služeb umožňujících efektivní obchodování.

