 Zůstat
Obchodní podmínky
Nástroje


According to flash estimates, the EU annual CPI skyrocketed to a record 10.7% in October whereas economists had projected a 10.2% increase. Investors were alarmed by the first response. Inflation has been accelerating faster than expected which is certainly a bad omen for investors because protracted soaring inflation has been hanging over the EU economy as the sword of Damocles. This inflation data was bearish for the euro which, in turn, dragged the pound sterling down through the positive correlation.
Notably, another round of inflation acceleration is a fresh signal for the ECB to resort to more aggressive monetary tightening. In other words, the central bank is expected to raise the key interest rates at a sharper pace so that the ECB might outpace the Federal Reserve in the ultimate size of interest rates. As a result, this could open the door for the euro's strength.

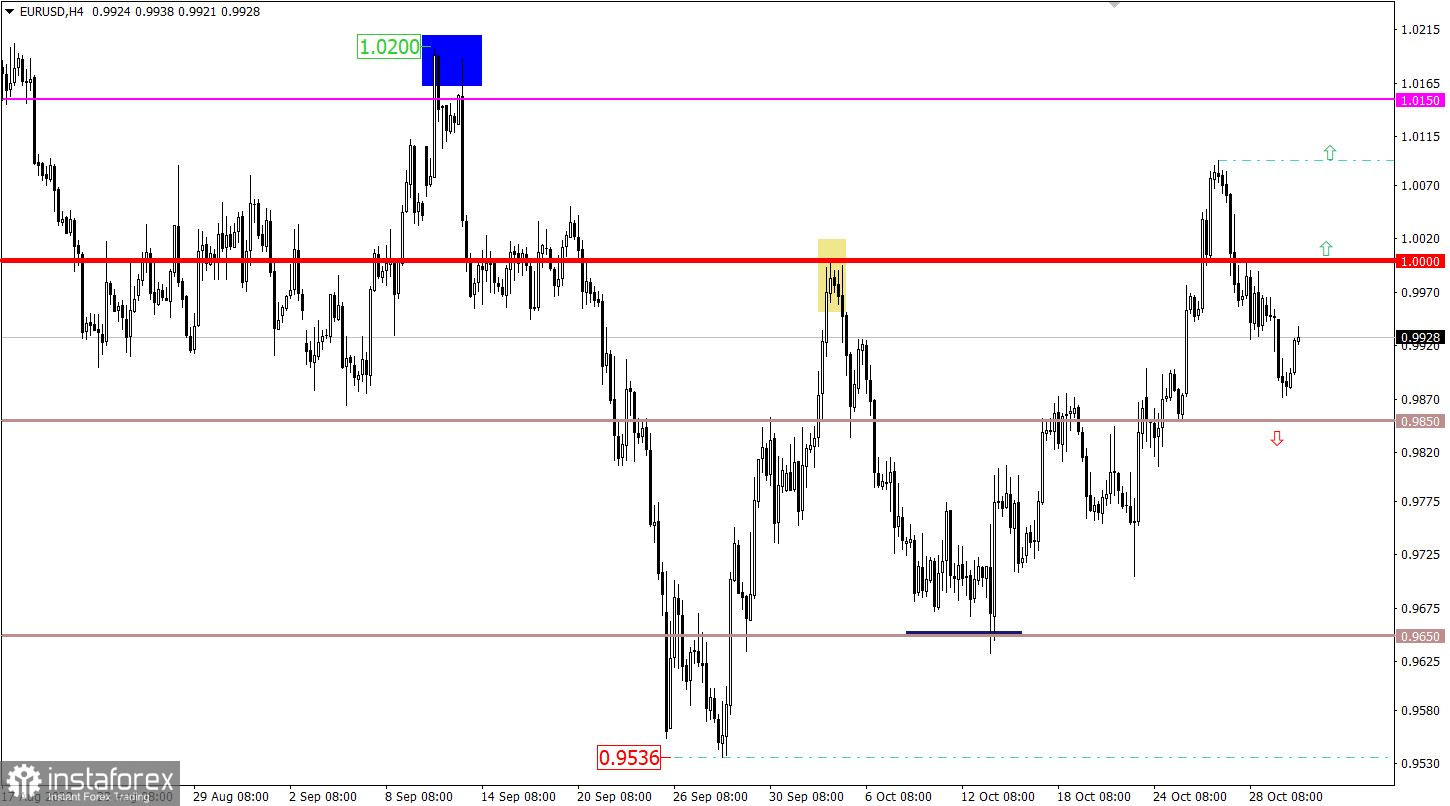
EUR/USD accelerated its decline in the course of speculative activity. In consequence, the currency pair sank below 0.9900. All in all, the euro has weakened almost 2% on the last three trading days which is roughly 200 pips.
GBP/USD quickly followed suit due to the positive correlation. This move broke the balance of bullish and bearish forces within the range between 1.1525/1.1645. The price plunged below 1.1500 intraday but returned to the previous range on the next trading day.
Economic calendar on November 1, 2022
Today, November 1, is All Saints Day. Therefore, markets are shut in Catholic European countries. The UK is due to release the manufacturing PMI which will hardly log significant changes. The US will also report the ISM manufacturing PMI which is expected to remain flat in October.
The only report worthy of your attention is the JOLTs job openings as the number of vacancies could have risen to 10.2 million from 10.1 million. Despite a minor change, growth in vacancies is a positive sign for the conditions in the US labor market. On the other hand, analytical think tanks suggest an alternative forecast according to which job openings could have dipped to 10.0 million. In this case, the US dollar might come under selling pressure.
UK manufacturing PMI – 9:30 GMT
US ISM manufacturing PMI – 13:45 GMT
JOLTs job openings (September) – 14:00 GMT
Trading plan for EUR/USD on November 1, 2022
The speculative buzz about short positions on EUR/USD could have happened intraday only. For this reason, the currency pair opened today with a rebound above 0.9900. Once the price settles above this level, the buyers will have an excuse to plan long positions because the price will rebound to the parity level.
As for the downside scenario, the price settlement below 1.9900 did not assure traders to increase short positions. Hence, the price balance is shifted 50 pips down to the level of 0.9850.
We can assume that buying sentiment is still valid for GBP/USD. Therefore, traders could prefer going long while the pair is trading within 1.1525/1.1645. As a result, the price could extend its ongoing upward cycle.
Importantly, we will be able to see an increase in long positions once the price settles above 1.1655. In turn, this will extend the upward move.

The candlestick chart type is white and black graphic rectangles with lines above and below. With a detailed analysis of each individual candle, you can see its characteristics relative to a particular time frame: opening price, closing price, intraday high and low.
Horizontal levels are price coordinates, relative to which a price may stop or reverse its trajectory. In the market, these levels are called support and resistance.
Circles and rectangles are highlighted examples where the price reversed in history. This color highlighting indicates horizontal lines that may put pressure on the asset's price in the future.
The up/down arrows are landmarks of the possible price direction in the future.
Díky analytickým přehledům společnosti InstaForex získáte plné povědomi o tržních trendech! Jako zákazníkovi společnosti InstaForex je Vám k dispozici velký počet bezplatných služeb umožňujících efektivní obchodování.


