 Zůstat
Obchodní podmínky
Nástroje


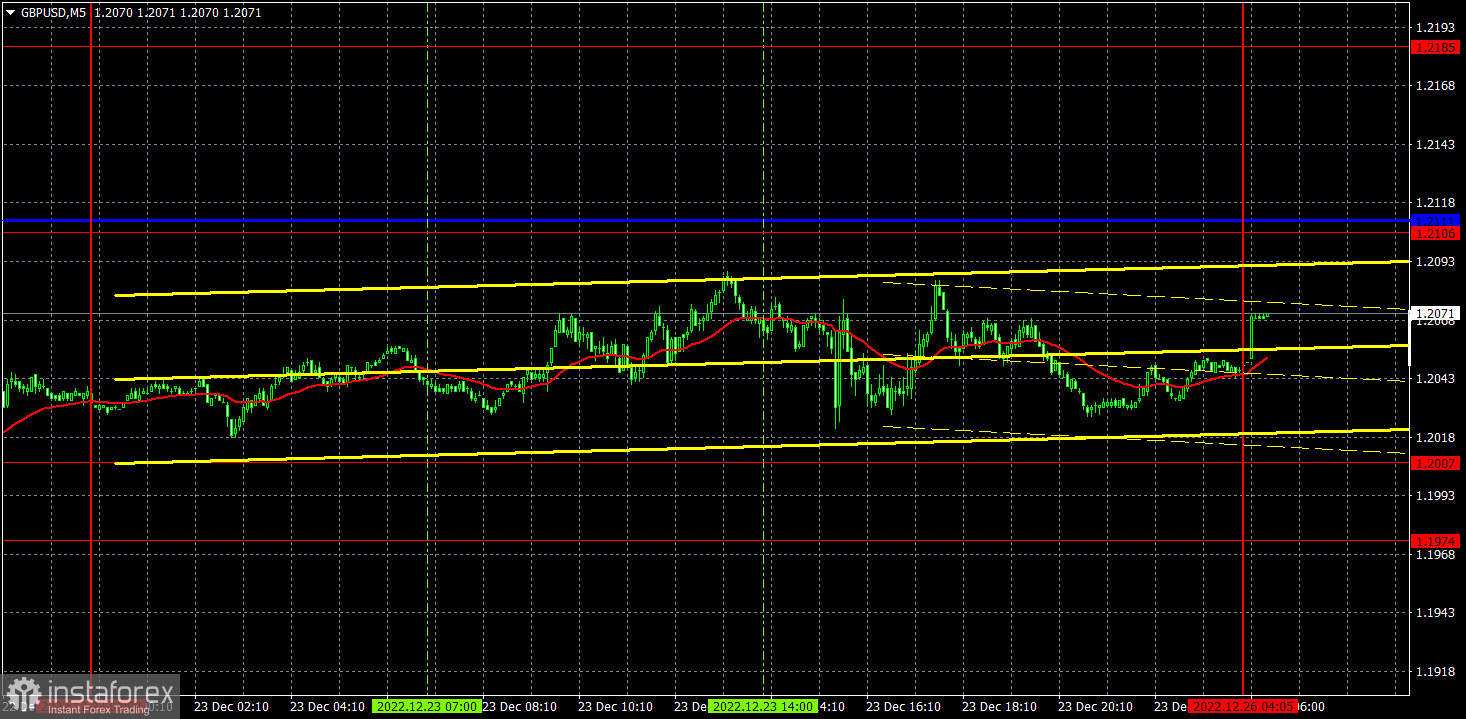
GBP/USD also traded flat on Friday, although before that it had shown at least some movement. However, Friday was a pre-Christmas day, so we are not surprised by the fact that it was flat the entire day. As far as macro data is concerned, there is nothing more to say in terms of the British currency. The same macro data from across the ocean could not move the Pound/Dollar pair. So we can only hope that Friday was an exception to the rule, and this week we will witness at least some movement. Although it is hard to count on active trades today, since it was Christmas yesterday.
Speaking of trading signals, the pound's situation was similar to the euro's, meaning there was nothing. The pair never approached any important level or the Ichimoku indicator line, so traders had no reason to enter the market.
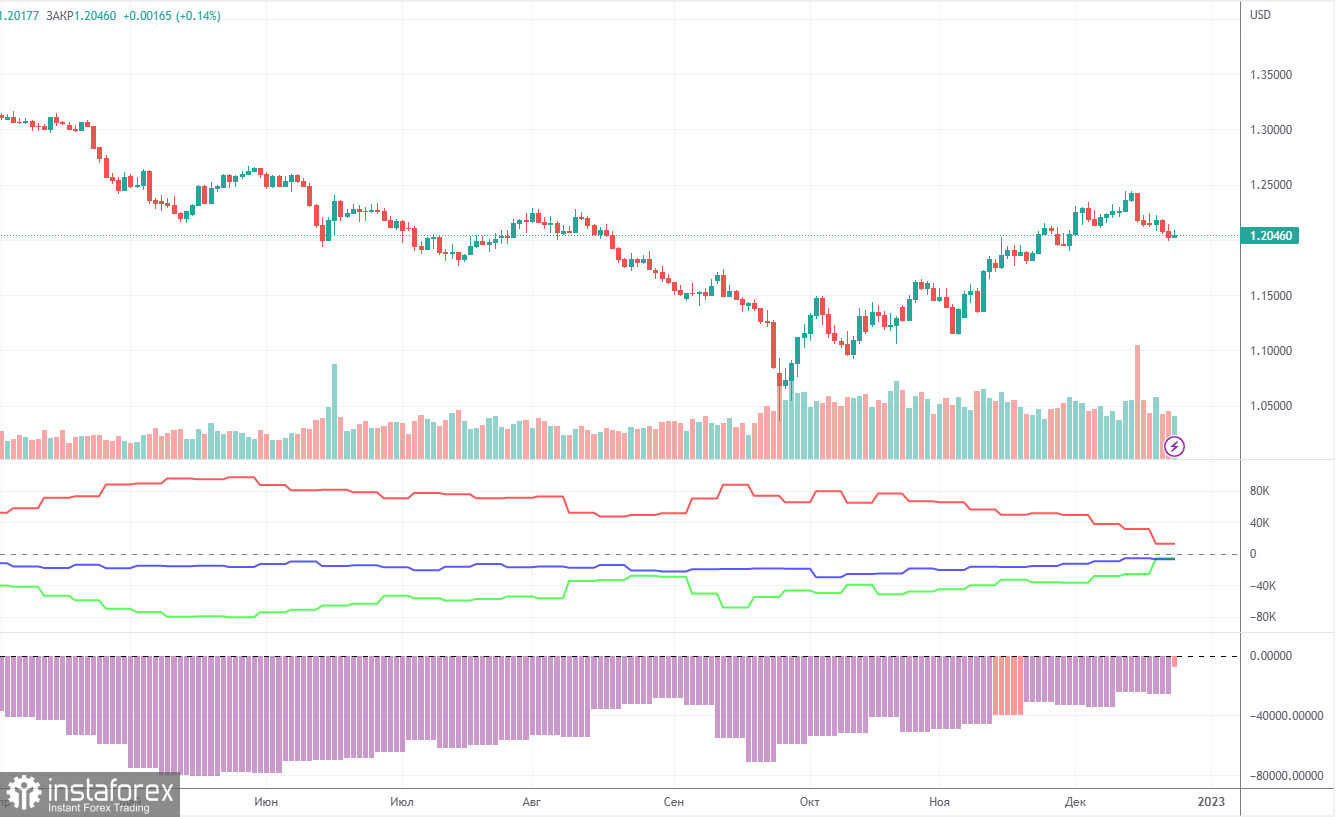
The latest COT report showed a decrease in bearish sentiment. During the given period, non-commercial traders opened 3,200 long positions and closed as many as 16,800 short positions. Thus, the net position grew by about 20,000, which is a lot for the pound. This figure has been on the rise for several months. Nevertheless, sentiment remains bearish, and GBP/USD is on the rise for no reason. I assume that the pair may well resume the downtrend soon since there is a need for at least a correction. Notably, both GBP/USD and EUR/USD now show practically identical movement. Since the net position is not even bullish yet, buying may continue for a few months to come. Non-commercial traders now hold 40,800,000 short positions and 35,200 long ones. The gap between them is small. I am still skeptical about the pound's long term growth, though there are technical reasons for it. At the same time, fundamental and geopolitical factors signal that the currency is unlikely to strengthen significantly.
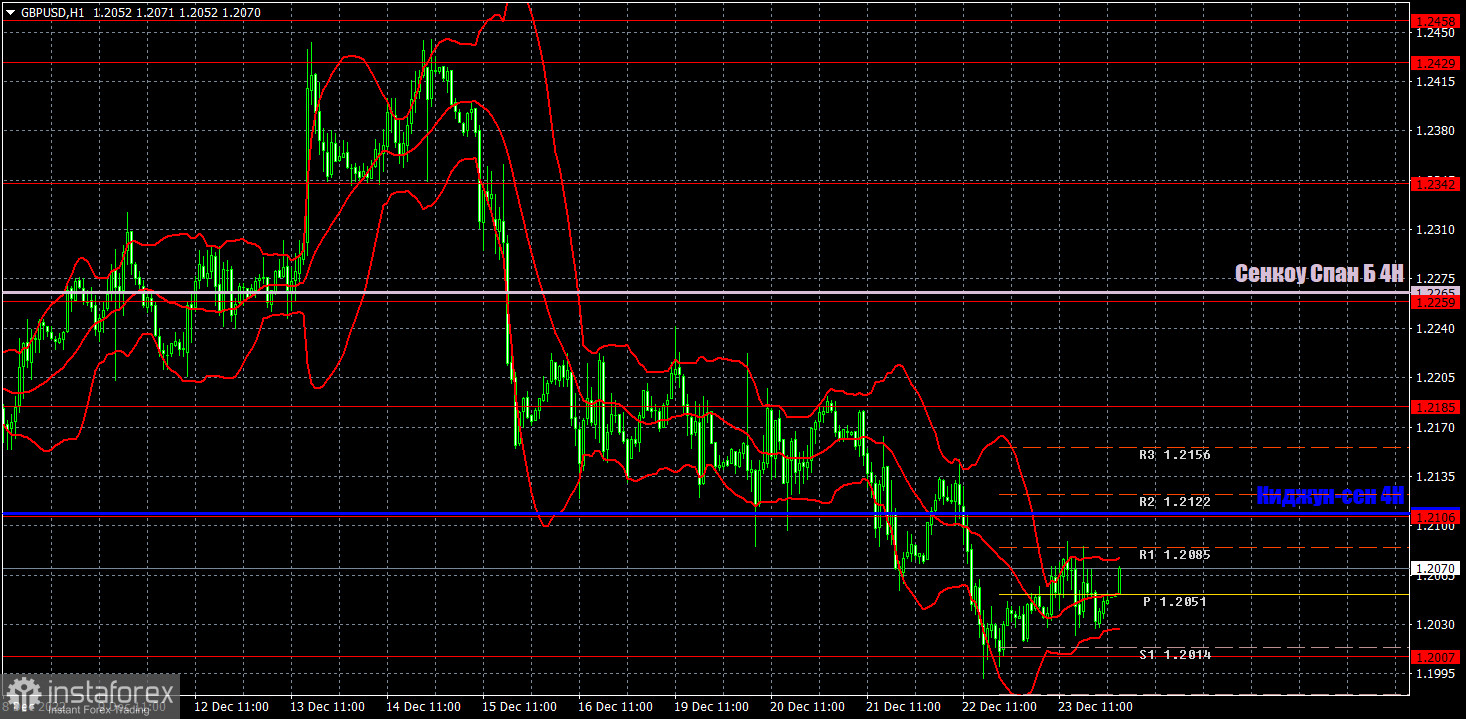
On the one-hour chart, GBP/USD is still trading below the lines of the Ichimoku indicator. Therefore, the downtrend persists, and the pound makes good use of New Year's Eve, since a bearish correction has been long overdue. But I suppose that the pair might be in a flat during the New Year week, which we should be ready for. On Monday, the pair may trade at the following levels: 1.1760, 1.1874, 1.1974-1.2007, 1.2106, 1.2185, 1.2259. Senkou Span B (1.2265) and Kijun Sen (1.2107) lines may also generate signals. Pullbacks and breakouts through these lines may produce signals as well. A Stop Loss order should be set at the breakeven point after the price passes 20 pips in the right direction. Ichimoku indicator lines may move during the day, which should be taken into account when determining trading signals. In addition, the chart does illustrate support and resistance levels, which could be used to lock in profits. There are no important events in the UK and the US, so there will be nothing to react to during the day. I believe that the flat will persist.
Price levels of support and resistance are thick red lines, near which the movement may end. They do not provide trading signals.
The Kijun-sen and Senkou Span B lines are the lines of the Ichimoku indicator, moved to the one-hour chart from the 4-hour one. They are strong lines.
Extreme levels are thin red lines from which the price bounced earlier. They provide trading signals.
Yellow lines are trend lines, trend channels, and any other technical patterns.
Indicator 1 on the COT charts reflects the net position size of each category of traders.
Indicator 2 on the COT charts reflects the net position size for the non-commercial group.
Díky analytickým přehledům společnosti InstaForex získáte plné povědomi o tržních trendech! Jako zákazníkovi společnosti InstaForex je Vám k dispozici velký počet bezplatných služeb umožňujících efektivní obchodování.


