 Zůstat
Obchodní podmínky
Nástroje


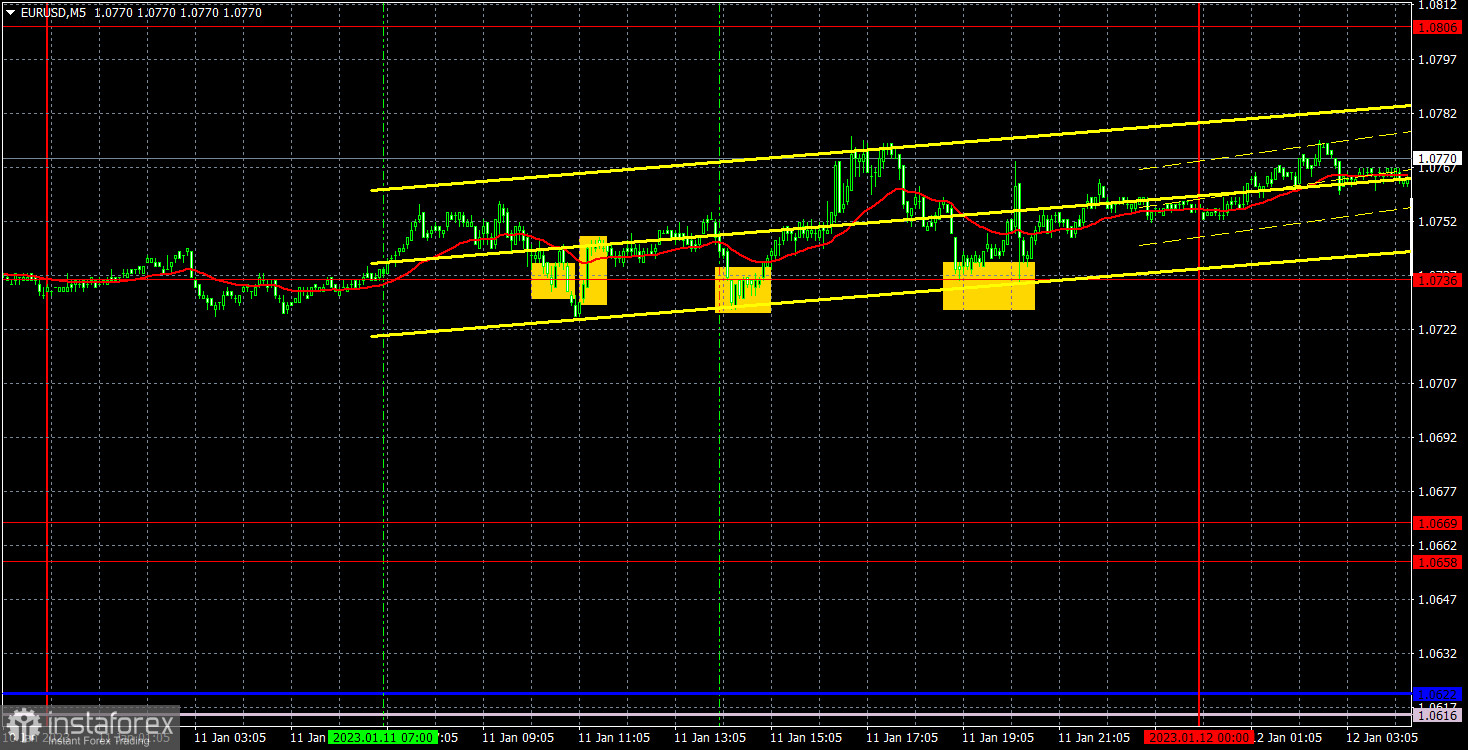
On Wednesday, EUR/USD continued to move mainly sideways. There was a slight upward bias, but the pair constantly rolled back down, constantly changing the direction of the movement. The US and the EU did not release any reports so traders had nothing to react to, but they still find reasons to buy the euro, though it is very difficult to do so. The pair failed to start a bearish correction normally, unlike the pound, and today, considering the movements of the last weeks, it will be very difficult to predict the market's reaction to the inflation report. It is better to say that with a high probability the market will try to interpret the report in favor of the euro again. If inflation is falling, that's bad for the dollar. If inflation is falling slowly or not at all, it's good for the dollar. Accordingly, inflation should slow down very weakly in December for the market to start buying the dollar. In other cases, the pair's growth is more likely.
All of the trading signals of the day were formed near 1.0736 and all of them were not accurate, but what else should we expect from the signals during the flat? Traders could try to use only the first two, but there was not even 15-point movement in the right direction neither in the first, nor in the second case, so both trades could make the loss. Unfortunately, yesterday it was impossible to avoid it.
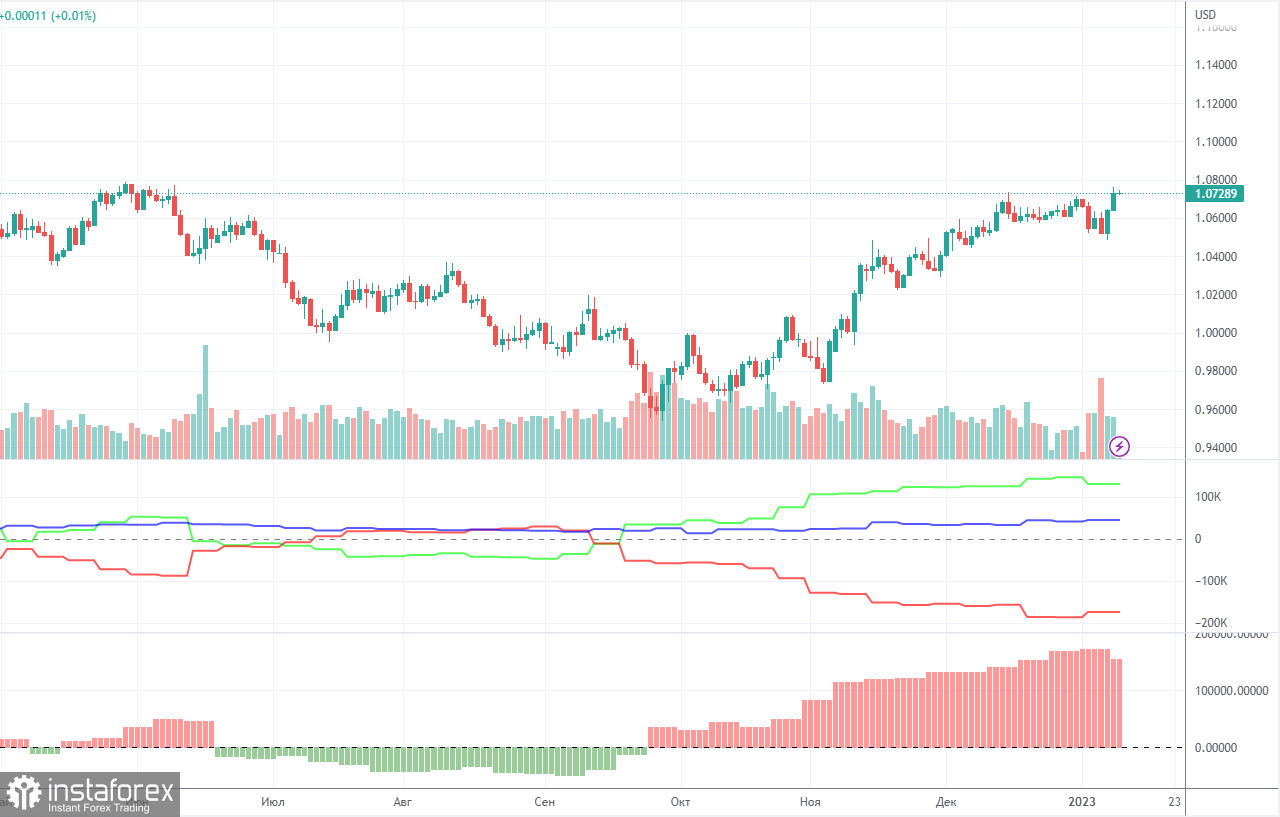
The COT reports for the euro in the last few months have been fully consistent with what is happening in the market. You can clearly see on the chart that the net position of big players (the second indicator) has been growing since early September. Around the same time, the euro started to grow. At this time, the net position of the non-commercial traders has been bullish and strengthens almost every week, but it is a rather high value that allows us to assume that the upward movement will end soon. Notably, the green and red lines of the first indicator have moved far apart from each other, which often means the end of the trend. During the given period, the number of long positions held by non-commercial traders decreased by 29,300, whereas the number of short positions fell by 13,100. Thus, the net positions decreased by 16,200. The number of long positions is 130,000 higher than the number of short positions opened by non-commercial traders. So the question now is how long will the big players increase their longs? Moreover, from a technical perspective, a bearish correction should have started a long time ago. In my opinion, this process can not continue for another 2 or 3 months. Even the net position indicator shows that we need to "unload" a bit, that is, to correct. The overall number of short orders exceeds the number of long orders by 44,000 (671,000 vs. 627,000).
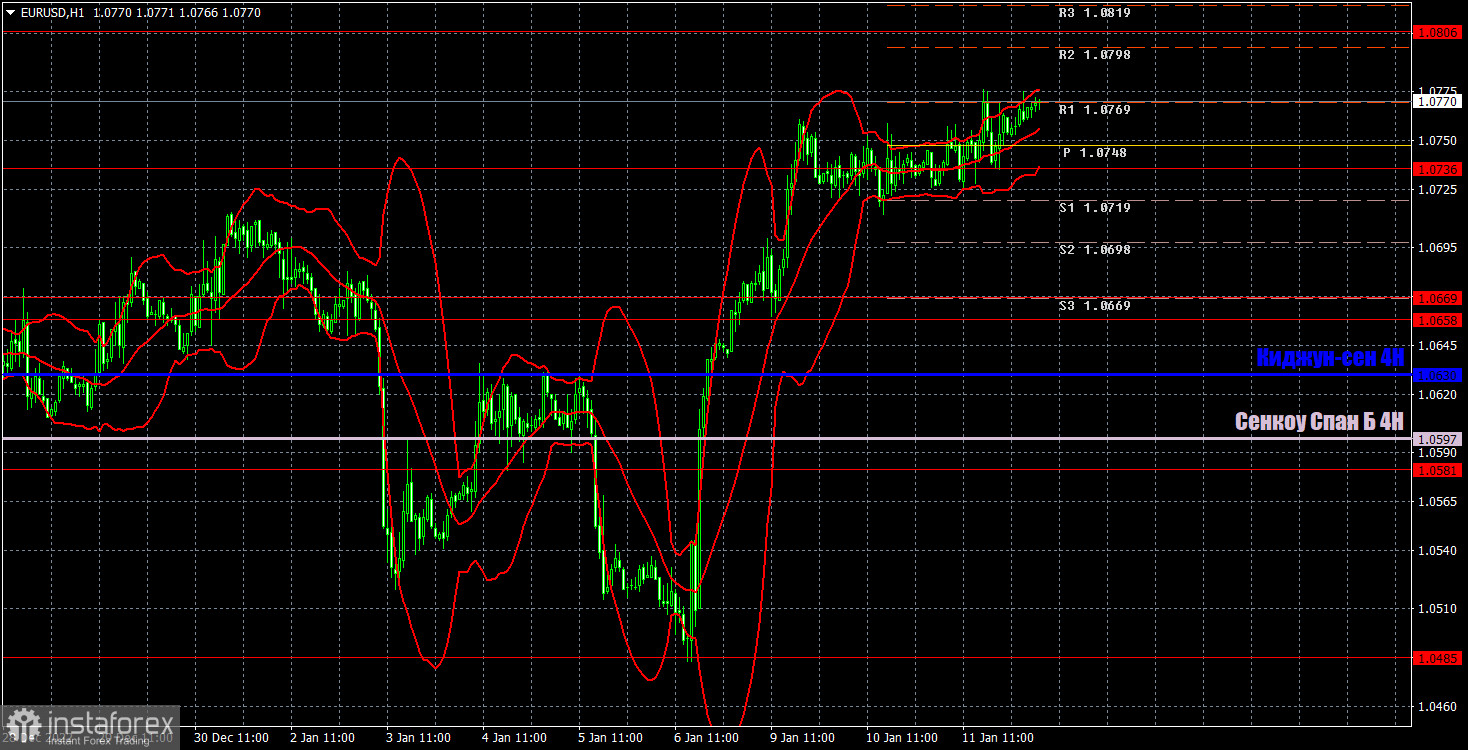
On the one-hour chart, EUR/USD continues the upward movement, which started last Friday. Yes, it has weakened, but it still continues even without a local correction. It might do the same thing today, if the US inflation data shows a slowdown as expected. On Thursday, the pair may trade at the following levels: 1.0485, 1.0581, 1.0658-1.0669, 1.0736, 1.0806, 1.0938, 1.1036, as well as Senkou Span B (1.0597) and Kijun-sen (1.0630). Lines of the Ichimoku indicator may move during the day, which should be taken into account when determining trading signals. There are also support and resistance levels, but signals are not formed near these levels. Bounces and breakouts of the extreme levels and lines could act as signals. Don't forget about stop-loss orders, if the price covers 15 pips in the right direction. This will prevent you from losses in case of a false signal. On January 12, the US will publish its inflation report. Meanwhile, the EU's calendar of events is empty. So everyone will focus on the inflation data.
Price levels of support and resistance are thick red lines, near which the movement may end. They do not provide trading signals.
The Kijun-sen and Senkou Span B lines are the lines of the Ichimoku indicator, moved to the one-hour chart from the 4-hour one. They are strong lines.
Extreme levels are thin red lines from which the price bounced earlier. They provide trading signals.
Yellow lines are trend lines, trend channels, and any other technical patterns.
Indicator 1 on the COT charts reflects the net position size of each category of traders.
Indicator 2 on the COT charts reflects the net position size for the non-commercial group.
Díky analytickým přehledům společnosti InstaForex získáte plné povědomi o tržních trendech! Jako zákazníkovi společnosti InstaForex je Vám k dispozici velký počet bezplatných služeb umožňujících efektivní obchodování.

