 Zůstat
Obchodní podmínky
Nástroje


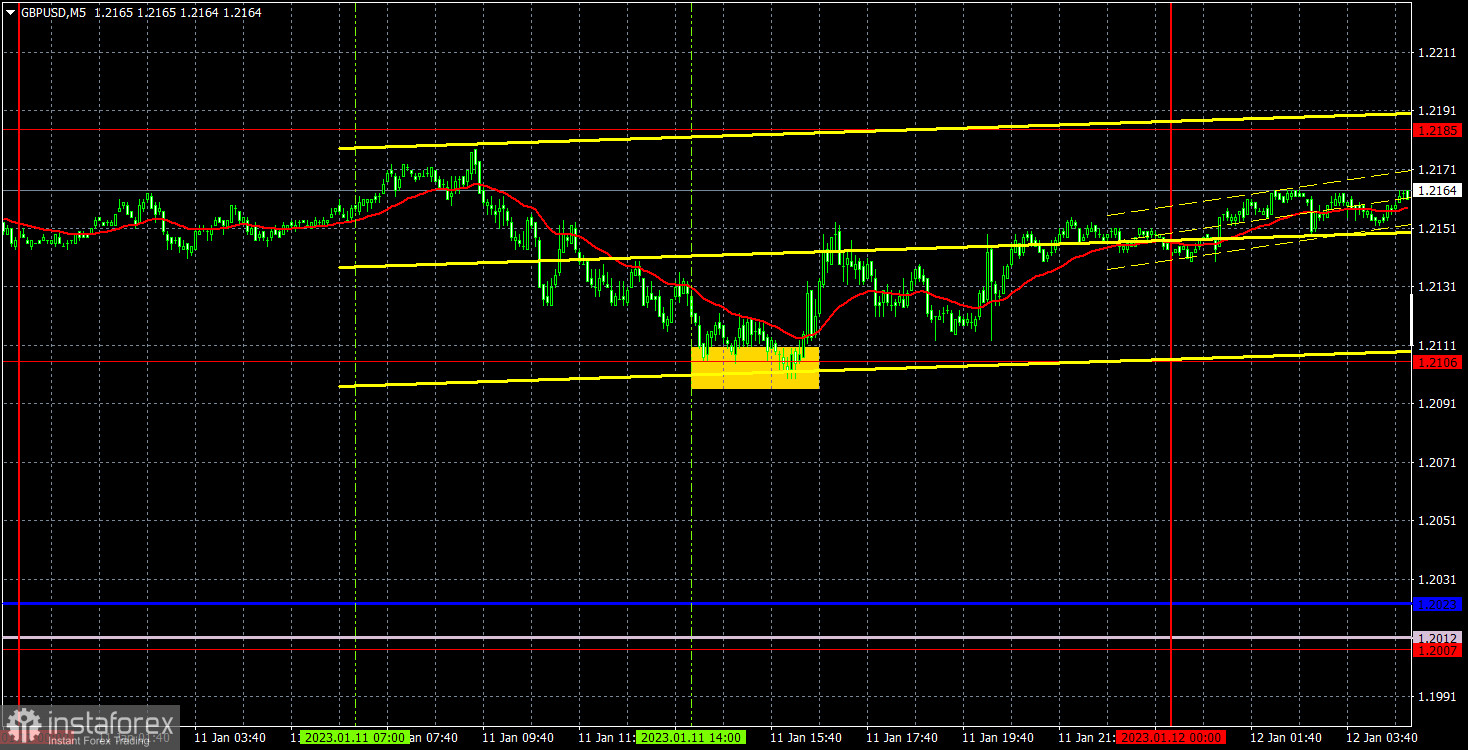
On Wednesday, GBP/USD ended a weak bearish correction after a rebound from 1.2106. Now it's approaching 1.2185, if GBP crosses this mark then the pair might rise further. I mentioned before that the downward movement would be more logical, but traders still use every opportunity to buy, but in most cases there are no macroeconomic or fundamental reasons for that. However, the pair's general trend is not that important for the weakest charts because trading is carried out by levels and lines. Therefore, in principle, it does not matter whether the market trades logically or not, as long as the movement itself is good and has a trend. But there is a problem with it now because the market does not always move like a trend even intraday.
Traders would say that they were lucky on Wednesday because there was only one signal -a rebound from 1.2106. After its formation and till the evening the price was able to grow by about 25 points, which traders could earn on this trade. There is also a probability of a flat between 1.2106 and 1.2185.
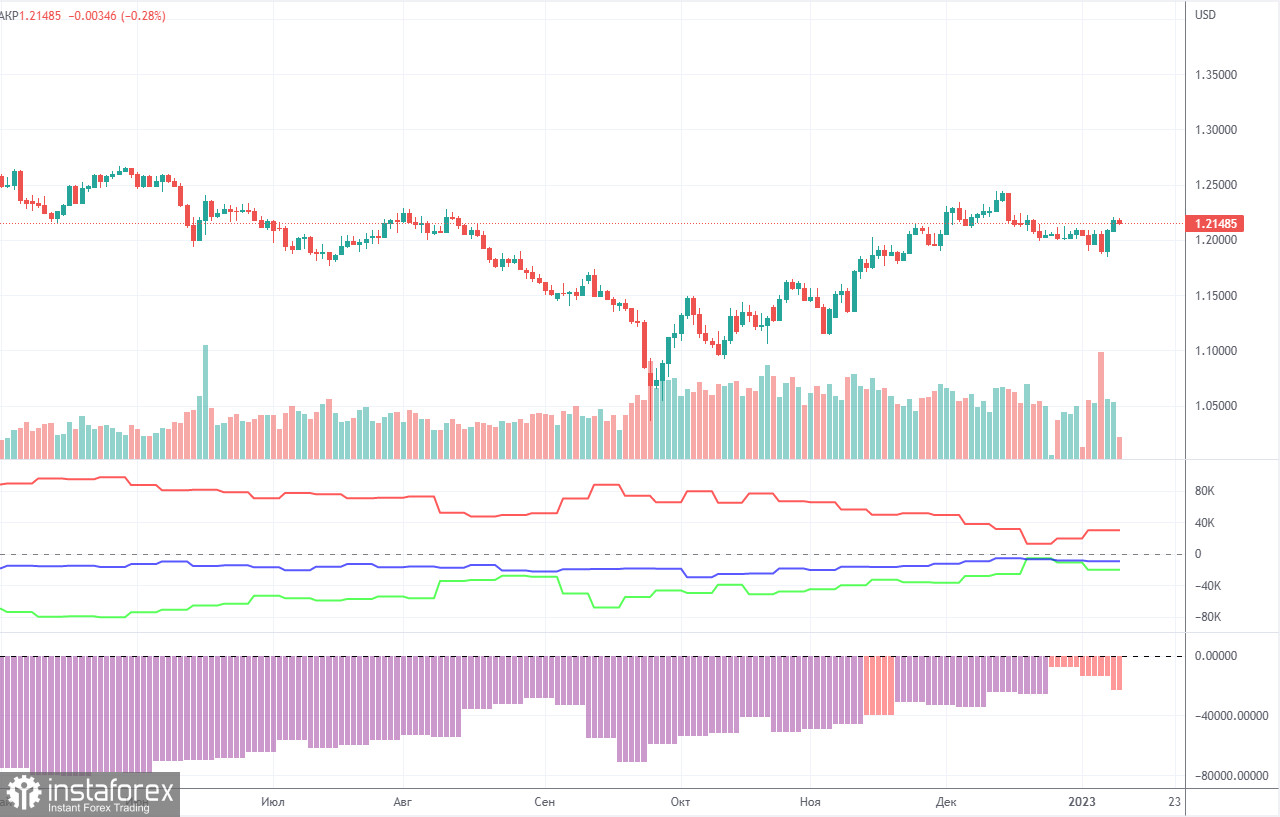
The latest COT report showed an increase in bearish sentiment. During the given period, non-commercial traders opened 3,000 long positions and as many as 12,400 short positions. Thus, the net position fell by about 9,400. This figure has been on the rise for several months, and the sentiment may become bullish in the near future, but it hasn't yet. Although the pound has grown against the dollar for the last few months, from a fundamental perspective, it is still difficult to answer why it keeps rising. On the other hand, it could fall in the near future (in the mid-term prospect) because it still needs a correction. In general, in recent months the COT reports correspond to the pound's movements so there shouldn't be any questions. Since the net position is not even bullish yet, traders may continue to buy the pair over the next few months. Non-commercial traders now hold 43,600,000 long positions and 63,900 short ones. I remain skeptical about the pound's long term growth, though there are technical reasons for it. At the same time, fundamental and geopolitical factors signal that the currency is unlikely to strengthen significantly.
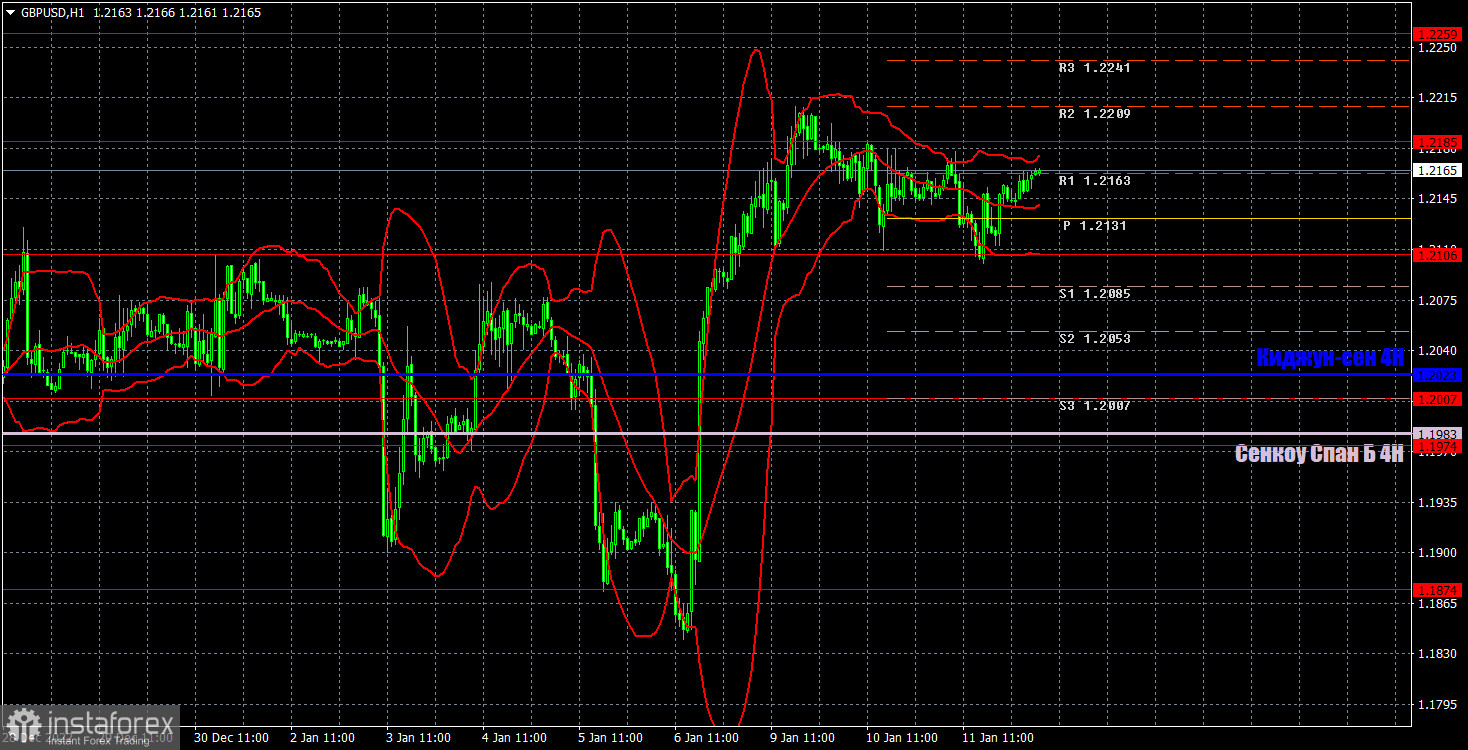
On the one-hour chart, GBP/USD has risen sharply, but so far it doesn't have any grounds for the continuation of growth. I assume that traders may start to buy the pound for no reason, but if we pay attention to the fundamentals and macroeconomics, the British currency should fall, not grow. Also, we should also consider the possibility that a "swing" or flat could start, and the market might probably have an illogical reaction to today's US inflation report. On January 12, the pair may trade at the following levels: 1.1760, 1.1874, 1.1974-1.2007, 1.2106, 1.2185, 1.2259, 1.2342, 1.2429-1.2458. The Senkou Span B (1.1983) and Kijun Sen (1.2023) lines may also generate signals. Pullbacks and breakouts through these lines may produce signals as well. A Stop Loss order should be set at the breakeven point after the price passes 20 pips in the right direction. Ichimoku indicator lines may move during the day, which should be taken into account when determining trading signals. In addition, the chart does illustrate support and resistance levels, which could be used to lock in profits. On Thursday, there are no important events planned for Great Britain, but the US will publish a really important report, which might affect the market sentiment a lot. Thus, volatility may increase during the day, but I don't expect the pair's movement to be logical.
Price levels of support and resistance are thick red lines, near which the movement may end. They do not provide trading signals.
The Kijun-sen and Senkou Span B lines are the lines of the Ichimoku indicator, moved to the one-hour chart from the 4-hour one. They are strong lines.
Extreme levels are thin red lines from which the price bounced earlier. They provide trading signals.
Yellow lines are trend lines, trend channels, and any other technical patterns.
Indicator 1 on the COT charts reflects the net position size of each category of traders.
Indicator 2 on the COT charts reflects the net position size for the non-commercial group.
Díky analytickým přehledům společnosti InstaForex získáte plné povědomi o tržních trendech! Jako zákazníkovi společnosti InstaForex je Vám k dispozici velký počet bezplatných služeb umožňujících efektivní obchodování.

