 Zůstat
Obchodní podmínky
Nástroje


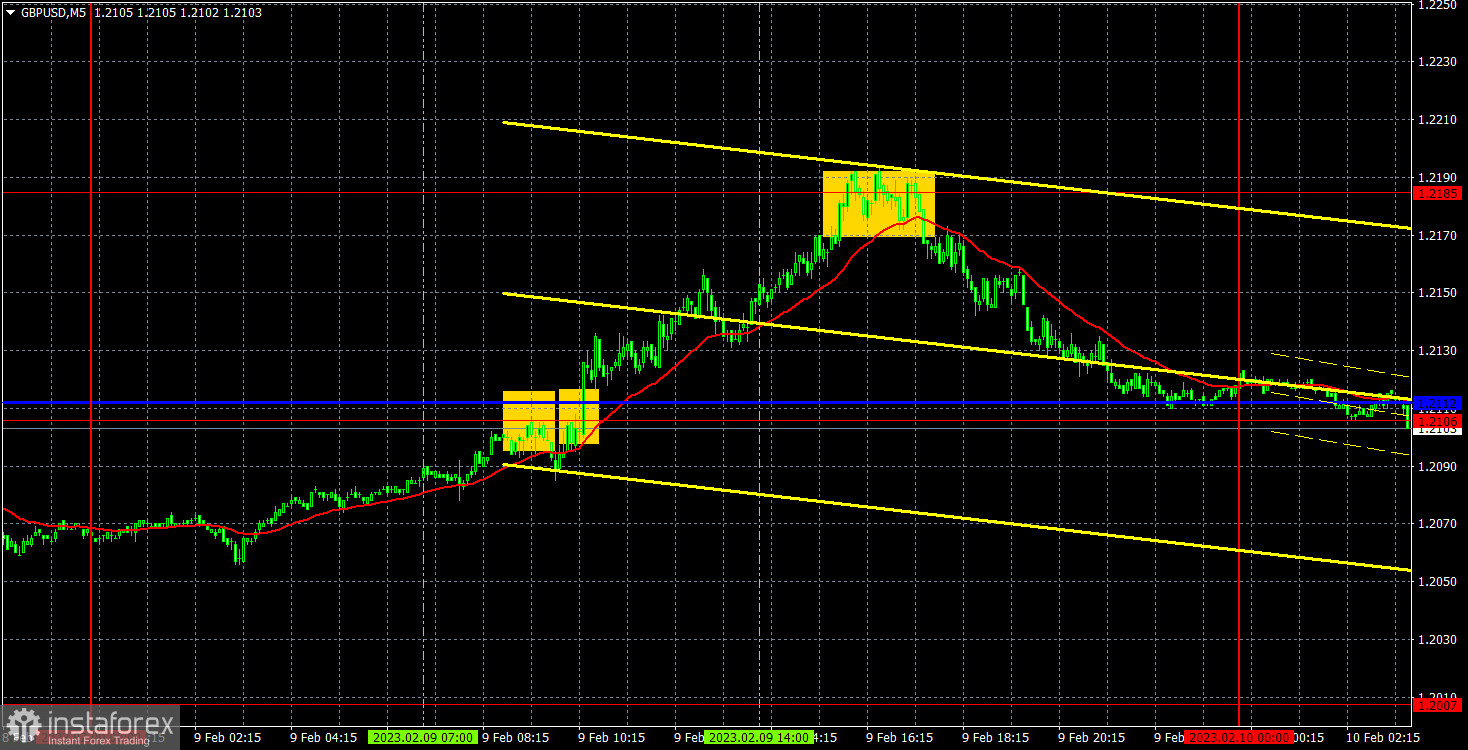
GBP/USD is trading upwards on Thursday, although by the end of the day it attempted to resume the decline. Its movement is similar with EUR/USD, which is not surprising as the fundamental background for both is the same. Only this morning, the UK published its GDP data, which showed that the economy grew by 0% in the fourth quarter, while in monthly terms it contracted by 0.5%. This is why the pair has a reason to fall today. But since the impact of fundamentals and macroeconomics are minimal now, the movement might only resemble a swing. This means that after an upward correction, expect a renewed decline in the pair, especially since it is still between the Kijun-Sen and Senkou Span B on the Hourly TF.
In terms of trading signals, the picture yesterday was very good. Although the first sell signal, which is a bounce from 1.2106, turned out to be false since the pair failed to go down and led to a loss of about 30 pips, the next buy signal was a correct ont. The quote went up to 1.2185, giving off profit of about 40 pips. By the end of the day, the pair returned to the Kijun-sen line, where 20-30 pips of profit could be gained.
COT report:
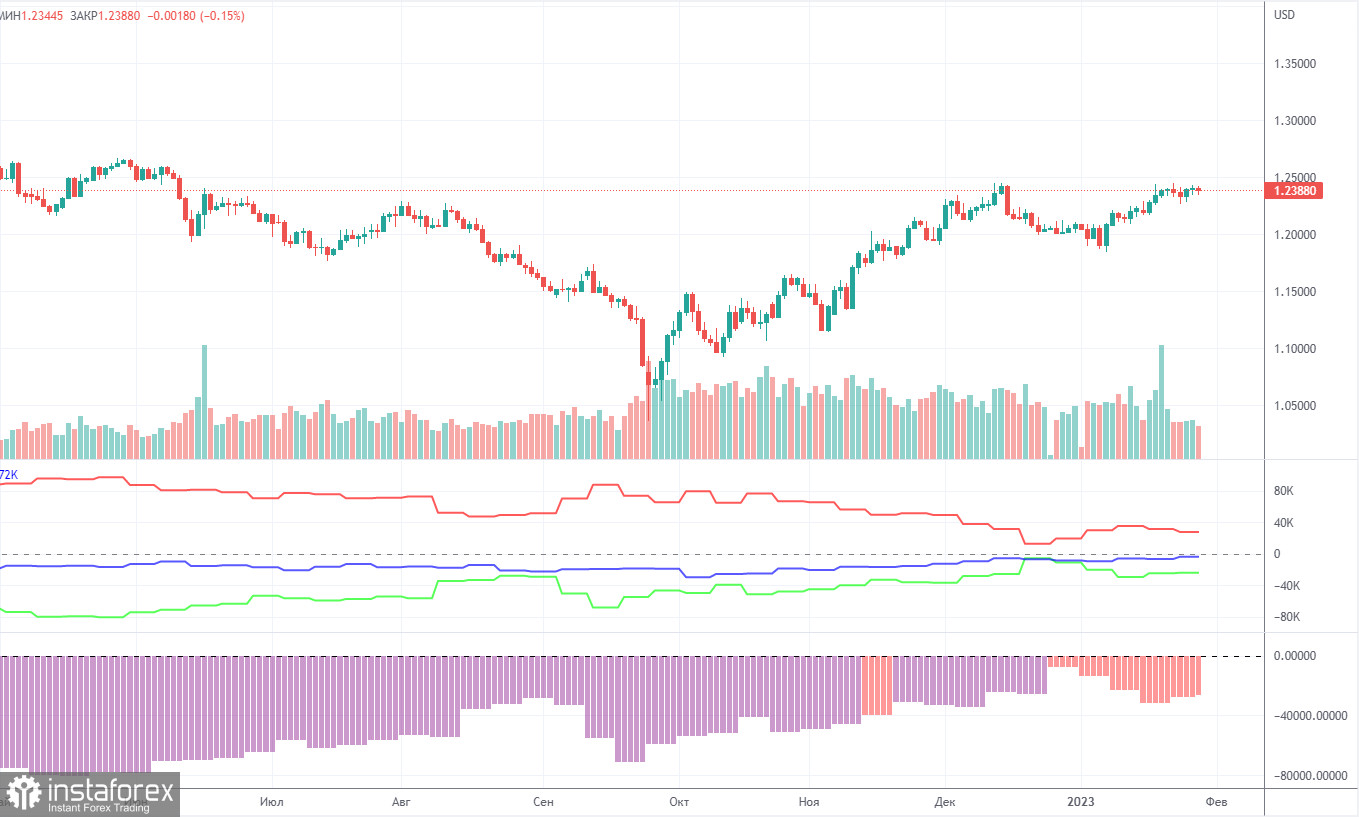
The latest COT report showed that the bearish sentiment has become weaker as during the week, non-commercial traders closed 6.7 thousand BUY contracts and 7.5 thousand SELL contracts. This pushes the net position of non-commercial traders up by 0.8 thousand. And with the net position steadily increasing in the past months, the mood of market players are likely to become bullish in the near future. However, even though pound has been rising against dollar in recent months, it is very difficult to pinpoint the exact reason. There is also a chance that it will fall in the future as the currency needs a correction.
On the whole, the COT reports are in line with the movement of pound in recent months. Since the net position is not bullish yet, traders may buy the asset in the next few months. For now, non-commercial traders have 35,000 buy positions and 59,000 sell positions. It is important to note though that it is uncertain whether pound will have a long-lasting growth. Although it has technical reasons for that, the fundamental and geopolitical factors do not presuppose a strong and fast increase.
Analysis of GBP/USD, 1-hour chart
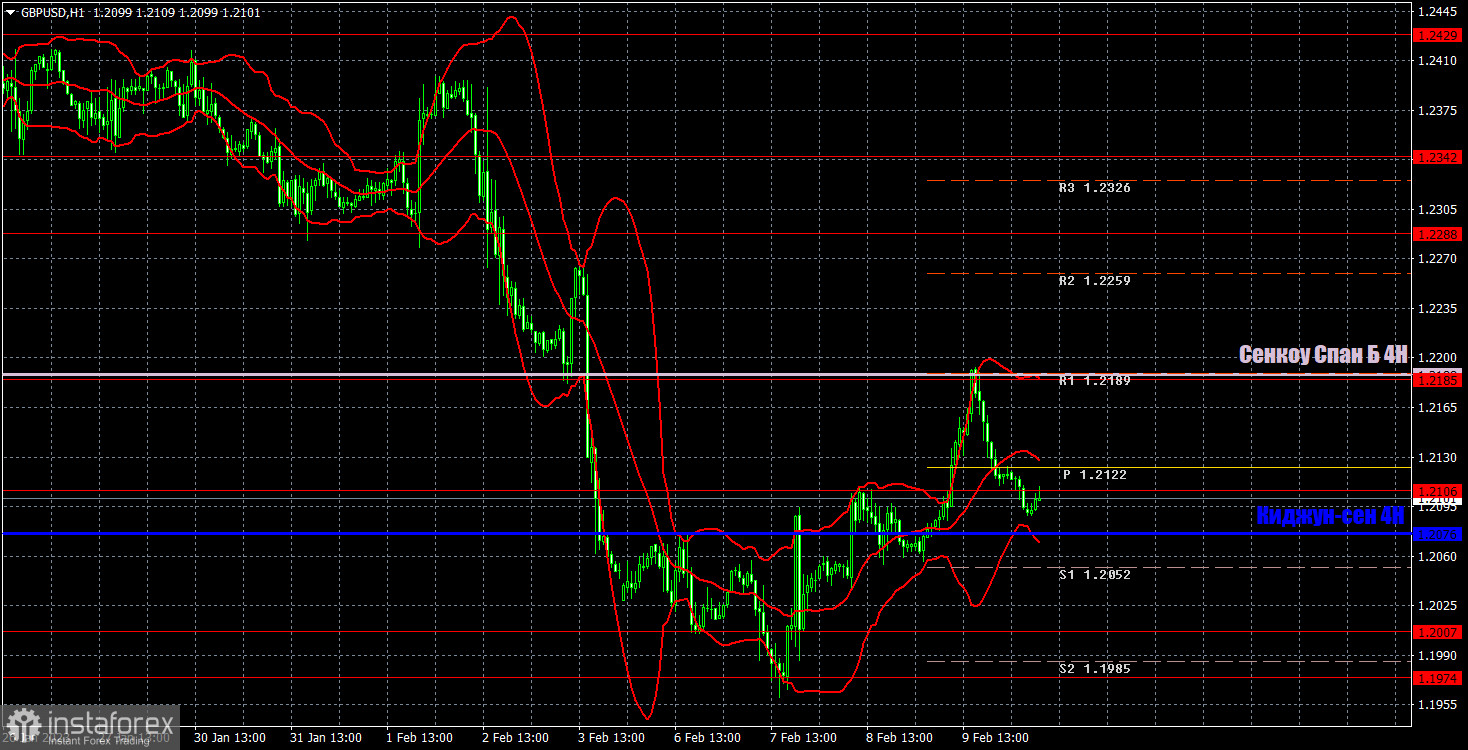
GBP/USD is trying to rise, but it is not very confident. After all, it is currently below the critical line, which is acting as strong resistance. Thus, bulls may fail to breakout and the downward trend may resume. However, before that, the pair may trade sideways for some days. These are important levels for February 10: 1.1760, 1.1874, 1.1974-1.2007, 1.2106, 1.2185, 1.2288, 1.2342. The Senkou Span B (1.2218) and Kijun-sen (1.2111) lines can give signals, as do rebounds and breakouts of these levels. It is recommended to place the stop loss level at the breakeven when the price covers 20 pips in the right direction. The lines of the Ichimoku indicator could move during the day, which should be taken into account when determining trading signals. There are also support and resistance levels that could be used to fix profits.
What is seen on the trading charts:
Price levels of support and resistance are thick red lines, near which the movement may end. They do not provide trading signals.
The Kijun-sen and Senkou Span B lines are the lines of the Ichimoku indicator, moved to the one-hour chart from the 4-hour one. They are strong lines.
Extreme levels are thin red lines from which the price bounced earlier. They provide trading signals.
Yellow lines are trend lines, trend channels, and any other technical patterns.
Indicator 1 on the COT charts reflects the net position size of each category of traders.
Indicator 2 on the COT charts reflects the net position size for the non-commercial group.
Díky analytickým přehledům společnosti InstaForex získáte plné povědomi o tržních trendech! Jako zákazníkovi společnosti InstaForex je Vám k dispozici velký počet bezplatných služeb umožňujících efektivní obchodování.

