 Zůstat
Obchodní podmínky
Nástroje


The macroeconomic calendar was empty. No important reports were released in the EU, the United Kingdom, and the Unites States.
In this regard, investors and traders focused on the incoming information and news flow.
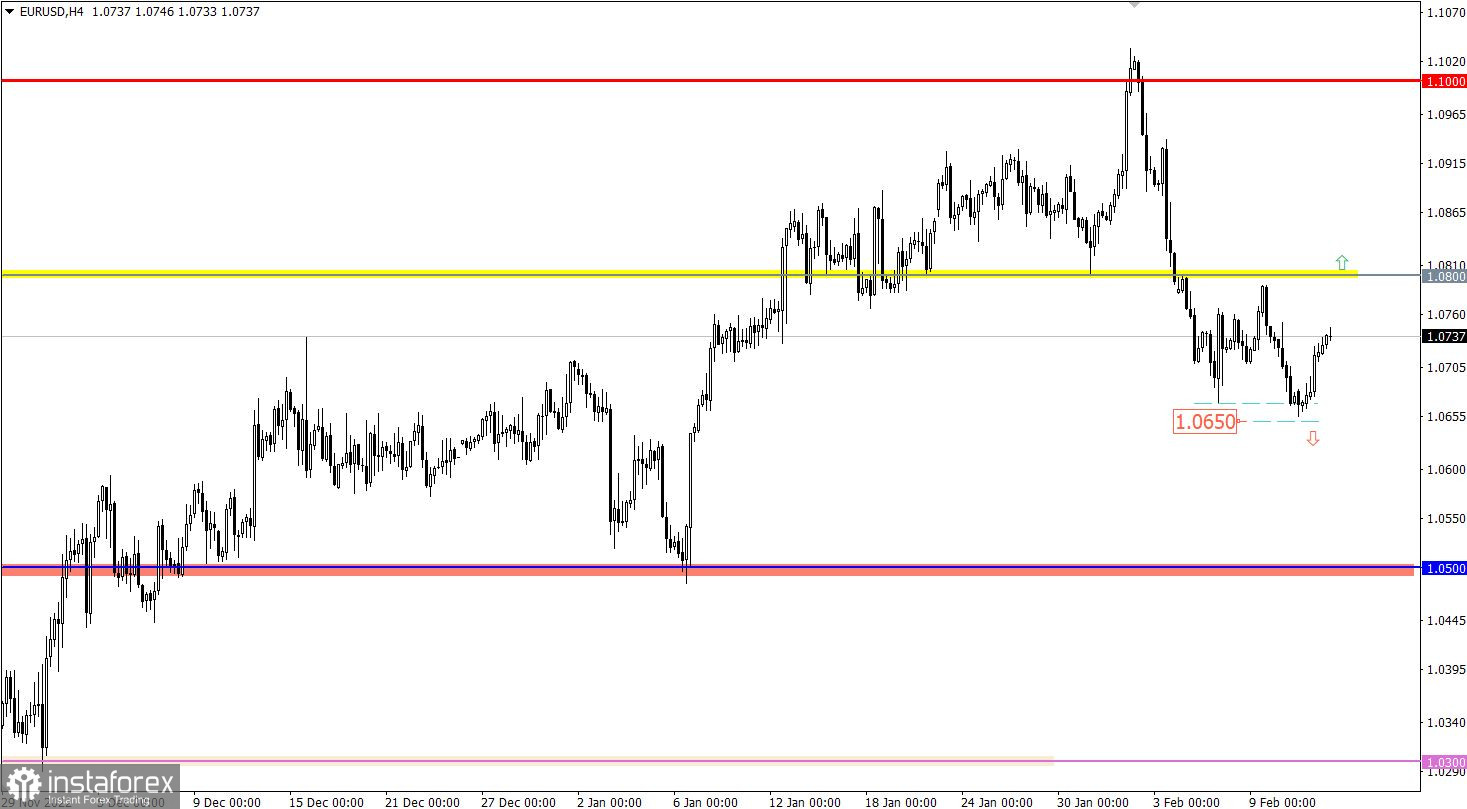
The EURUSD currency pair failed to stay below 1.0650, and instead there was a reduction in the volume of short positions. This led to a slowdown in the downward cycle, and a price rebound. But it is worth noting that the 1.0650/1.0670 area has previously played the role of support, thus traders expected such a denouement.
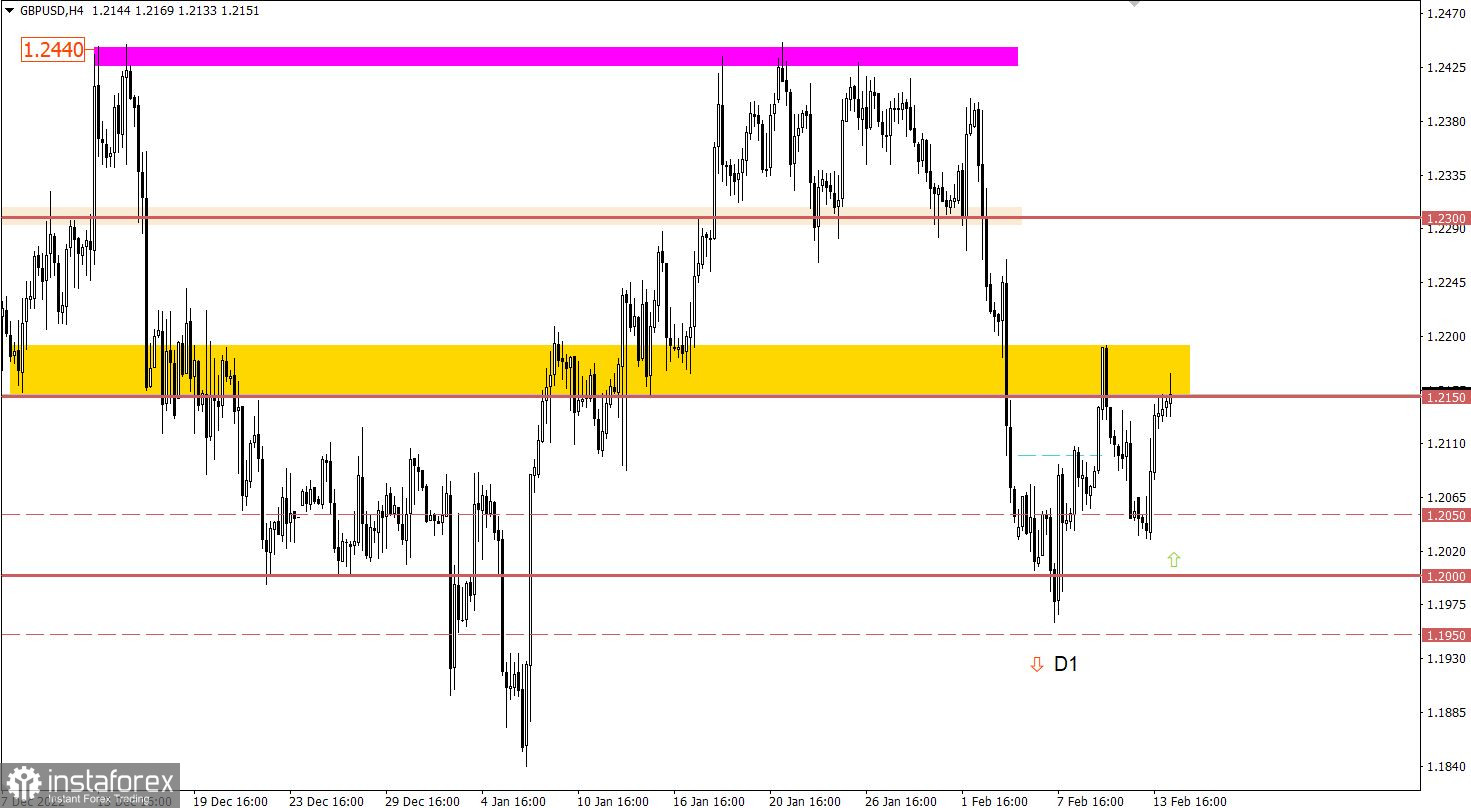
The GBPUSD currency pair once again reduced the volume of short positions around the 1.2000 psychological level. This step led to a price rebound, which returned the quote to the level of 1.2150.

Today, with the opening of the European session, data on the UK labor market was released. Unemployment remained at 3.7%, which coincided with the forecast; employment, meanwhile, rose by 74,000, and the number of applications for unemployment benefits declined by 12,900. If we disregard the unemployment rate, then the data on the UK labor market came out quite well.
For this reason, the pound sterling has maintained its position in the market.
The second estimate of the Q4 2022 GDP in the eurozone is expected. Data is predicted to coincide with the previous estimate, in which case we should not expect any reaction in the market. In case there is a divergence of expectations, there may be an increase in speculative activity on the euro.
The main event is the publication of the inflation data in the United States. According to the forecast, the growth rate of consumer prices may slow down from 6.5% to 6.3%. This is a positive economic signal, which may give speculators confidence that the Fed will soon complete its current cycle of interest rate hikes and announce a gradual reduction in interest rates. Based on this theory, we can assume the weakening of dollar positions in the market.
However, if inflation slows weaker than predicted, there could be a backlash in the market. That is, the U.S. dollar will go up, and U.S. stock indices will move down.
Time targeting:
EU GDP – 10:00 UTC
U.S. Inflation – 13:30 UTC
At the moment, it is impossible to say with complete certainty that there has been a change in trading interests. The rebound can serve as a temporary regrouping of trading forces relative to the current correction cycle.
As for the change in trading interests, the primary technical signal will come from the market at the moment the price stays above 1.0800. In this case, there may be a phased process of recovery of the euro against the corrective move.
In this situation special attention will be paid to the level of 1.2150, as price retention above it in the four-hour period will lead to the subsequent strengthening of the pound sterling.
However, the area of this level has already played the role of resistance, so a lack of proper price retention above it may lead to a rebound.
The candlestick chart type is white and black graphic rectangles with lines above and below. With a detailed analysis of each individual candle, you can see its characteristics relative to a particular time frame: opening price, closing price, intraday high and low.
Horizontal levels are price coordinates, relative to which a price may stop or reverse its trajectory. In the market, these levels are called support and resistance.
Circles and rectangles are highlighted examples where the price reversed in history. This color highlighting indicates horizontal lines that may put pressure on the asset's price in the future.
The up/down arrows are landmarks of the possible price direction in the future.
Díky analytickým přehledům společnosti InstaForex získáte plné povědomi o tržních trendech! Jako zákazníkovi společnosti InstaForex je Vám k dispozici velký počet bezplatných služeb umožňujících efektivní obchodování.

