 Zůstat
Obchodní podmínky
Nástroje


Data released on Tuesday showed that the S&P CoreLogic Case-Shiller 20-city home price index in the US rose 4.6% year-on-year in December. However, the rate of price growth slowed down compared to November (6.8%) and was the lowest since July 2020. Negative statistics did not put pressure on the dollar, which is at odds with fundamental analysis.
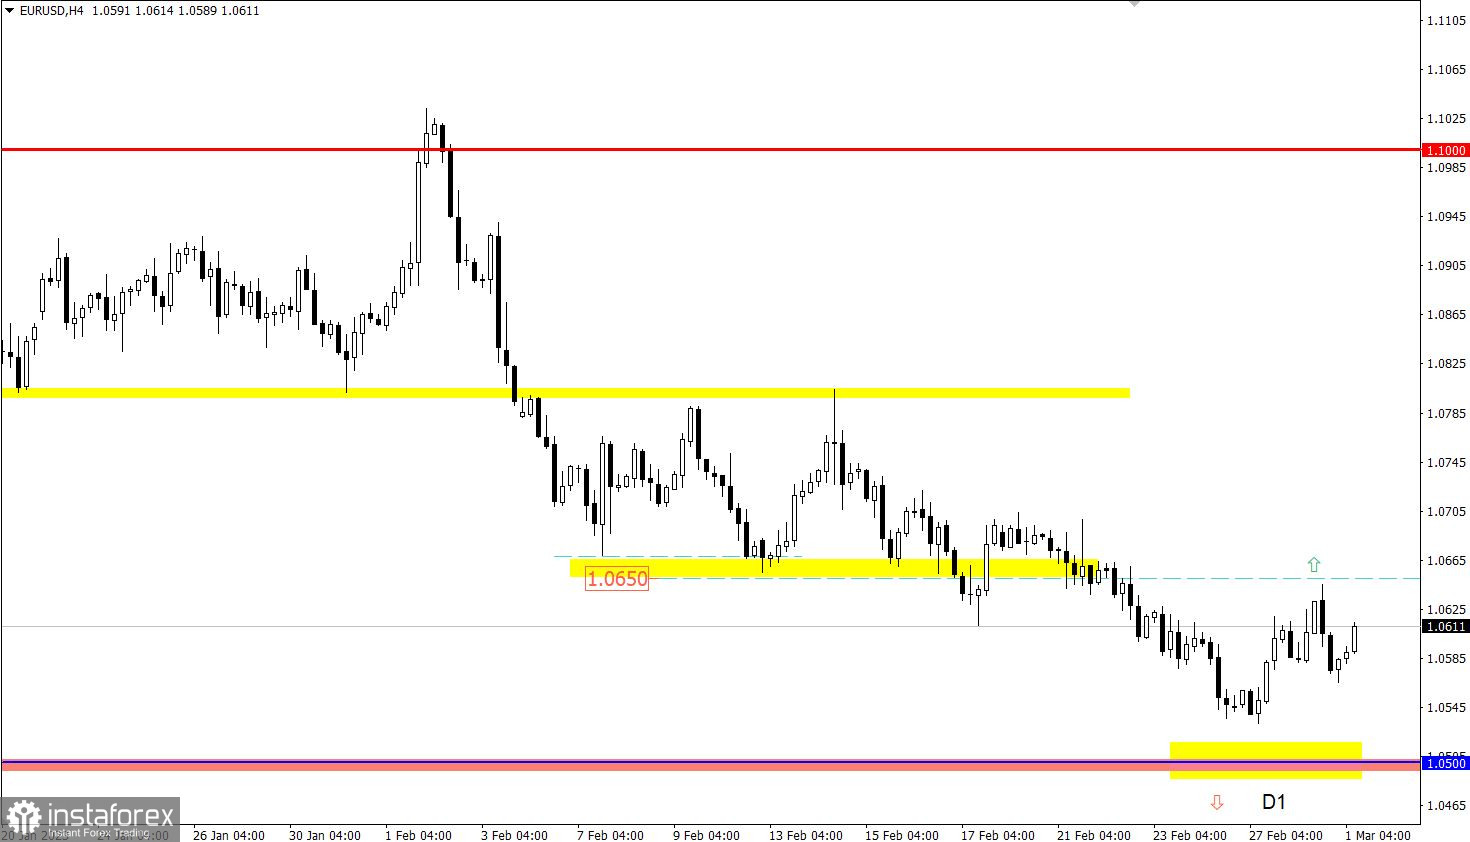
EUR/USD failed to recover. The pullback from the 1.0500 level did not reach the 1.0650 benchmark, which indicates that the downside mood among the market participants remains.
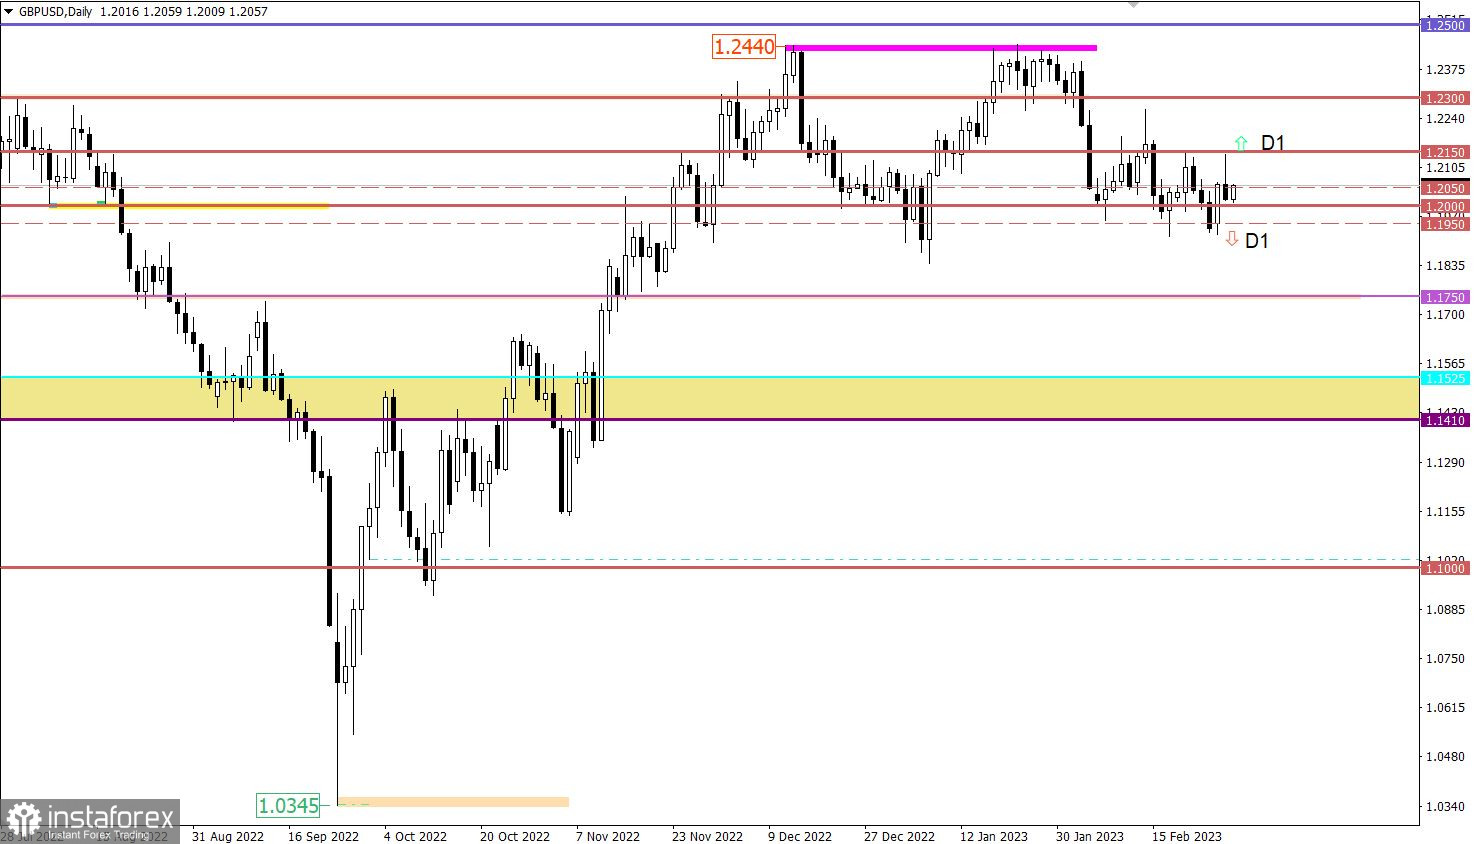
There was a sharp change in the price of the GBP/USD, which can be explained by the speculative activity of market participants. The British pound fluctuated within more than 120 points, but this did not lead to radical changes on the trading chart. Ultimately, the quotes ended the trading day near the 1.2000 psychological level.

UK lending market data is expected to be released, and forecasts point to growth. Mortgage lending plays an important role in the country's economy, as real estate transactions and construction make up more than 20% of the GDP of the United Kingdom. The growth of the lending market can be a positive factor for the economy and will support the pound sterling.
In Europe, the United Kingdom, and the United States, data on business activity indices in the manufacturing sector are expected today. However, the data that will be presented will most likely only confirm the preliminary estimates already taken into account in the market. If the final data do not differ much from expectations, we can expect a further fall in the euro, although this decline will not be very significant.
Time targeting:
EU Manufacturing PMI – 09:00 UTC
UK lending market – 09:30 UTC
UK Manufacturing PMI – 09:30 UTC
US Manufacturing PMI – 14:45 UTC
Despite an unsuccessful attempt to restore the euro, its quote did not reach the local low of the downward cycle. If the quote does not fall below 1.0530, buyers will have a new chance to restore the rate. However, the main technical signal about the increase in the volume of long positions in the euro will be formed only after the price stays above 1.0650.
Looking at the price changes, we can conclude that market participants continue to interact with the 1.2000 level. To get a clear technical signal about the end of the current cycle of fluctuations, it is necessary to go beyond the control values.
If the price holds above 1.2150, traders will consider an upward scenario, which is likely to lead to a gradual recovery of the pound sterling.
The downward scenario will become relevant after the price holds below 1.1950 for a long time.
The candlestick chart type is white and black graphic rectangles with lines above and below. With a detailed analysis of each individual candle, you can see its characteristics relative to a particular time frame: opening price, closing price, intraday high and low.
Horizontal levels are price coordinates, relative to which a price may stop or reverse its trajectory. In the market, these levels are called support and resistance.
Circles and rectangles are highlighted examples where the price reversed in history. This color highlighting indicates horizontal lines that may put pressure on the asset's price in the future.
The up/down arrows are landmarks of the possible price direction in the future.
Díky analytickým přehledům společnosti InstaForex získáte plné povědomi o tržních trendech! Jako zákazníkovi společnosti InstaForex je Vám k dispozici velký počet bezplatných služeb umožňujících efektivní obchodování.

