 Zůstat
Obchodní podmínky
Nástroje


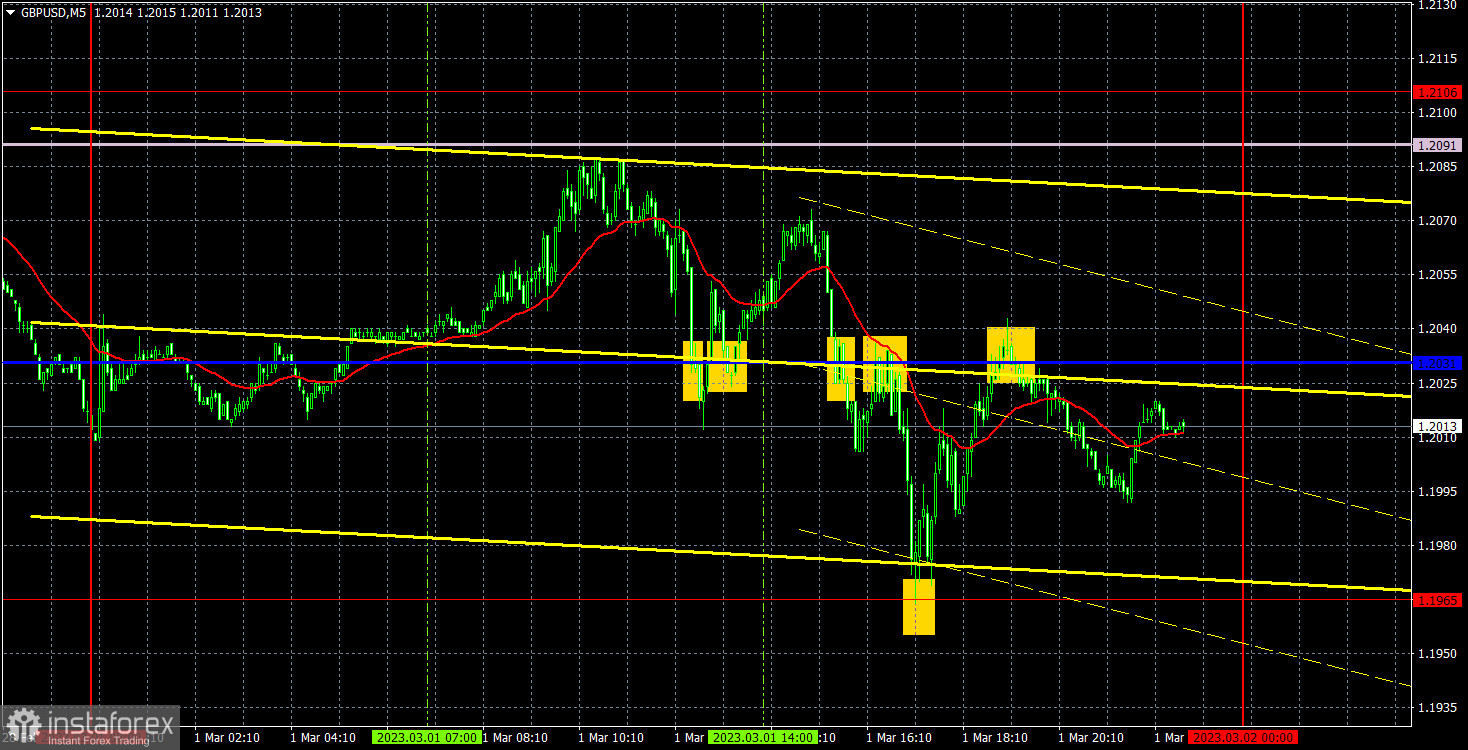
GBP/USD showed a downtrend on Wednesday, but there were constant reversals in different directions, which significantly complicated the trading process. There were at least 5 global price reversals. The most interesting thing is that, actually, the only important report of the day - ISM manufacturing activity index - was priced in a very strange way. At first, the dollar gained 50 points, but in the next hour, it fell down just as much. The report itself turned out to be slightly better than the last month, but worse than expected. It is difficult to say why the pair had been changing its direction before the report was published. However, in my last articles, I already mentioned that the pair went in a "swing" mode. The Ichimoku indicator lines are ignored or can be ignored most of the time. Now is not the most favorable time to trade.
There is almost no point in considering Wednesday's trading signals, because all but one were formed near the critical line. Naturally, most of them turned out to be false. Traders could try to work only the first two. First, the pair settled below the Kijun-Sen line, then above it. In the first case, there was a 30 pips loss. In the second case, Stop Loss triggered at Breakeven. The next signal available for execution was formed near 1.1965, which was also executed by some miracle. The buy signal made it possible for traders to earn about 35 pips, covering the loss of the first trade. Thus, the day ended even with the least amount of profit, but, of course, traders do not count on such trades.
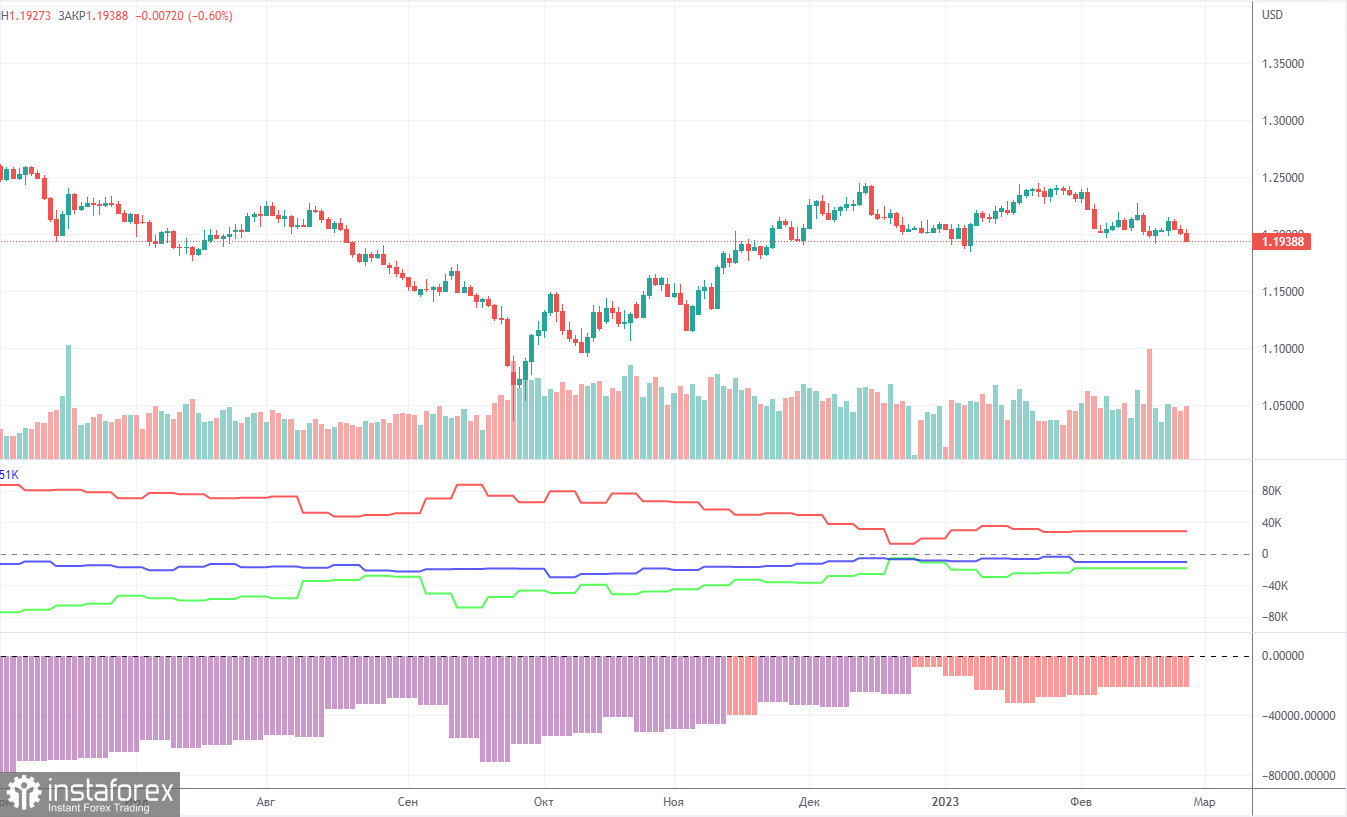
The COT report for the British pound has not been out for a month. The report for January 31 became available on Friday, which makes no sense since it came out a month ago. This report showed minimal changes. In the reporting week, non-commercial traders opened 1,400 long positions while the number of shorts decreased by 4,100. Thus, the net position of non-commercial traders increased by almost 10,000. The value of the net position has been steadily rising in recent months, but large market players are still bearish, and the GBP is rising against the USD (in the medium term), but from a fundamental perspective, it is very difficult to answer the question why it does it. The pound could start to fall in the near future. Formally, it has already started, but so far it looks like a flat. Take note that both major pairs are moving in a similar way, but the net position of the euro is positive and even implies an end of the upward movement, while it is negative for the pound... The non-commercial group of traders has a total of 54,000 long positions and 36,000 shorts. I am still rather skeptical about the long-term uptrend in the pound. The fundamental and geopolitical backgrounds do not favor a strong and swift rise in the British currency.
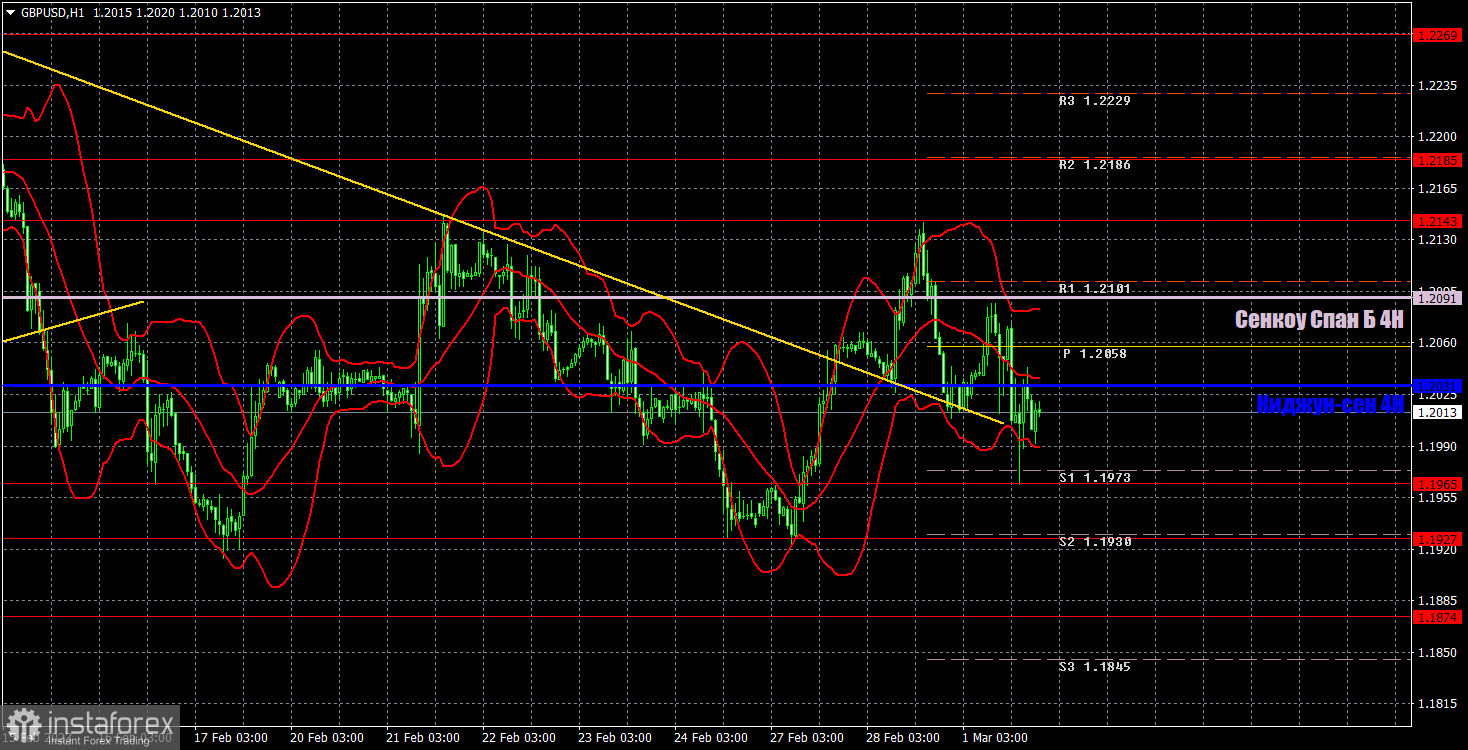
On the one-hour chart, GBP/USD is trading in a "swing" mode rather than a trend. This is noticeable even on the one-hour chart, not to mention the higher ones. Thus, the lines of the Ichimoku indicator are losing their strength. After the price has settled above the descending trend line, in fact, nothing has changed. It did not move up and the pair failed to renew even its last local high. On March 2, it is recommended to trade at the key level of 1.1760, 1.1874, 1.1927-1.1965, 1.2143, 1.2185, 1.2269. The Senkou Span B (1.2091) and Kijun Sen (1.2031) lines can also generate signals. Rebounds and breakouts from these lines can also serve as trading signals. It is better to set the Stop Loss at breakeven as soon as the price moves by 20 pips in the right direction. The lines of the Ichimoku indicator can change their position throughout the day which is worth keeping in mind when looking for trading signals. On the chart, you can also see support and resistance levels where you can take profit. On Thursday, Huw Pill from the Bank of England will speak in the UK and Christopher Waller from the Federal Reserve will speak in the US. These are all interesting events. Subject to important statements, market reaction may follow, but the probability is low.
Resistance/support - thick red lines, near which the trend may stop. They do not make trading signals.
Kijun-sen and Senkou Span B are the Ichimoku indicator lines moved to the hourly timeframe from the 4-hour timeframe. They are also strong lines.
Extreme levels are thin red lines, from which the price used to bounce earlier. They can produce trading signals.
Yellow lines are trend lines, trend channels, and any other technical patterns.
Indicator 1 on the COT chart is the size of the net position of each trader category.
Indicator 2 on the COT chart is the size of the net position for the Non-commercial group of traders.
Díky analytickým přehledům společnosti InstaForex získáte plné povědomi o tržních trendech! Jako zákazníkovi společnosti InstaForex je Vám k dispozici velký počet bezplatných služeb umožňujících efektivní obchodování.

