 Zůstat
Obchodní podmínky
Nástroje


Weekly data on jobless claims in the United States recorded an increase. This is a negative factor for the U.S. labor market.
Statistics details:
The volume of continuing claims for benefits rose from 1.649 million to 1.718 million.
The volume of initial claims for benefits rose from 190,000 to 211,000.
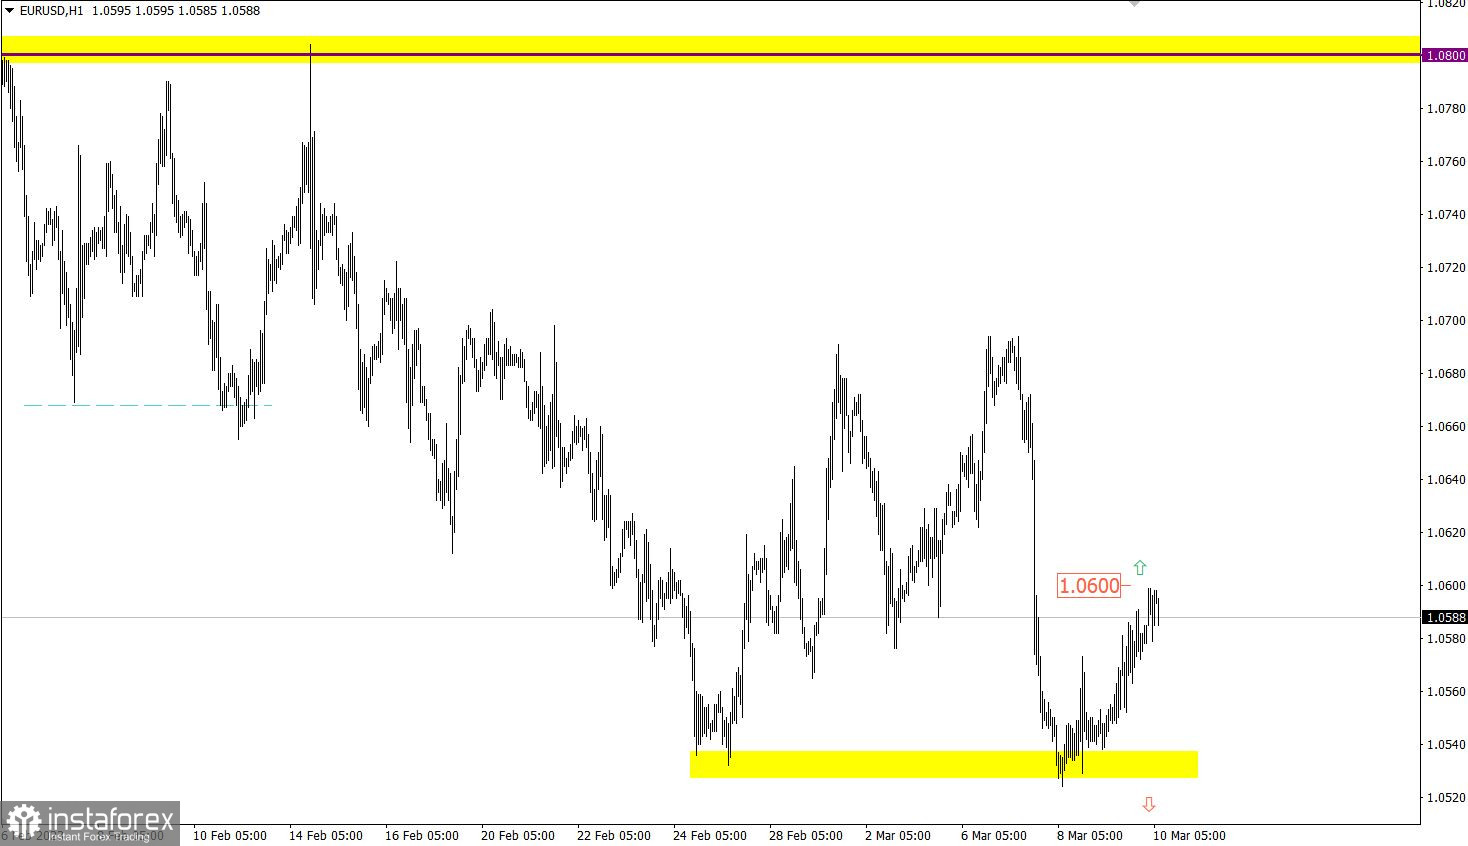
EURUSD slowed down the downward trend around the value of 1.0520, which corresponds to the stagnation in the market last February 24–27, when there was also a decrease in the volume of short positions. As a result, the euro gradually went up, which partially restores its position after the recent decline.
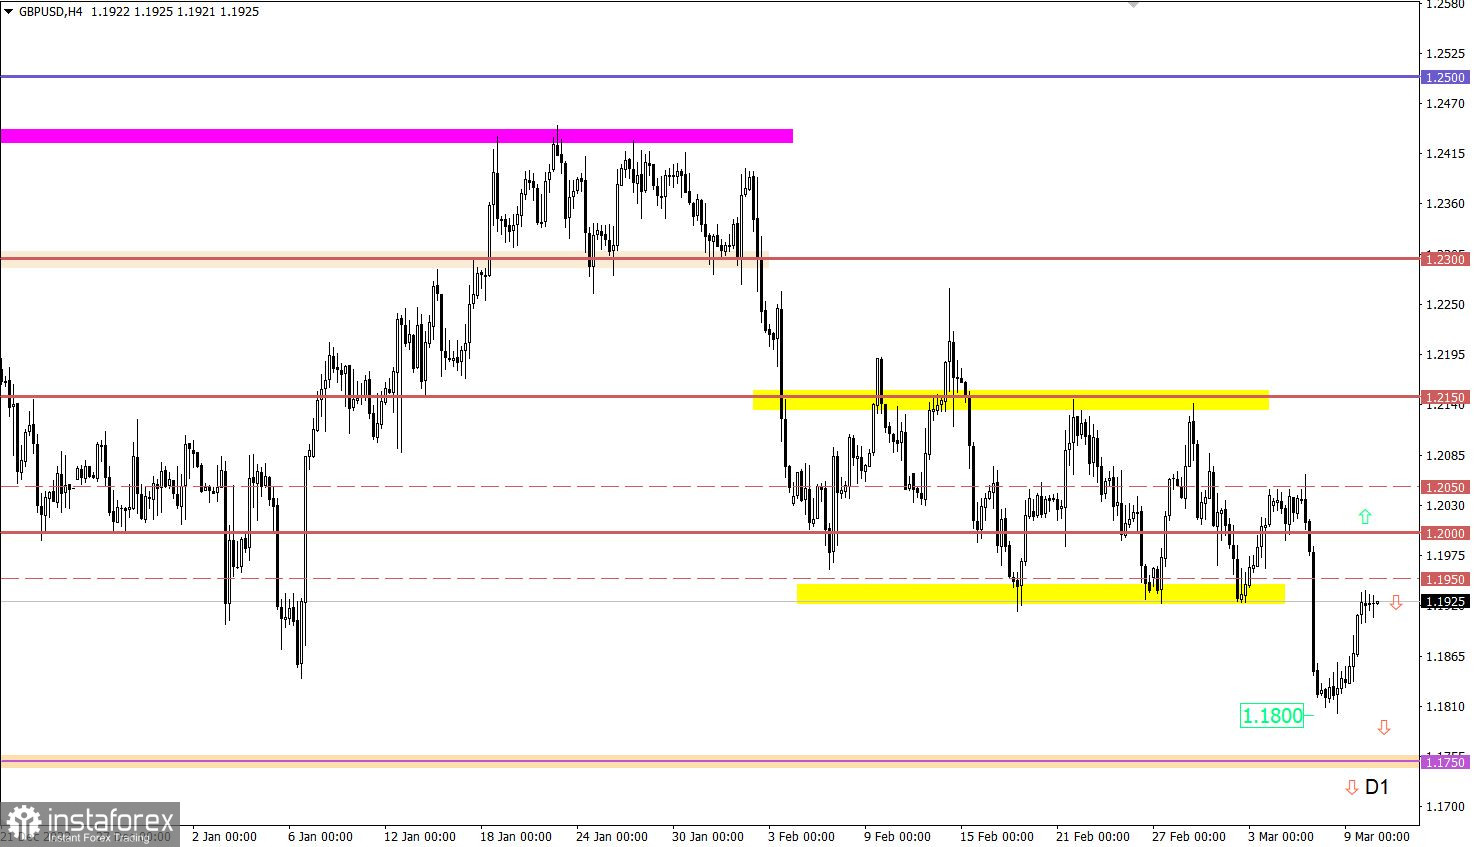
The volume of short positions on the GBPUSD currency pair was reduced around the 1.1800 mark, which led to a slowdown in the downward cycle and the subsequent reversal of quotes. As a result, the pound sterling partially recovered its value from the March 7 decline.

One of the most important events of the week is the report from the U.S. Department of Labor, which is likely to affect the market and speculators.
The unemployment rate is projected to remain at 3.4%. However, the main indicator of the report will be the number of new jobs created outside of agriculture. Last month, 517,000 new jobs were created, and this time only 205,000 are projected. While this is enough to keep the labor market stable, a significant slowdown in new job creation will be seen as a clear deterioration, resulting in a marked weakening of the U.S. dollar.
Time targeting:
United States Department of Labor Report – 13:30 UTC
The U.S. Department of Labor report will be the main factor for new speculations on the market. The price movement will be determined depending on the received statistical data. Considering the technical analysis, if the euro holds above 1.0600 during the four-hour period, it may lead to further rate growth and a full recovery after the recent decline.
The downward scenario will be considered if the price holds below 1.0520.
Due to the current dynamics of quotes, the price returned to the lower border of the side channel 1.1920/1.2150. At present, the 1.1920/1.1950 levels may act as resistance, which, according to technical analysis, may lead to a reduction in the volume of long positions on the pound and a possible price rebound down.
However, if the market participants continue to maintain an upward mood and the quote consolidates above 1.2000, then there is a possibility of further growth in the value of the pound sterling.
The candlestick chart type is white and black graphic rectangles with lines above and below. With a detailed analysis of each individual candle, you can see its characteristics relative to a particular time frame: opening price, closing price, intraday high and low.
Horizontal levels are price coordinates, relative to which a price may stop or reverse its trajectory. In the market, these levels are called support and resistance.
Circles and rectangles are highlighted examples where the price reversed in history. This color highlighting indicates horizontal lines that may put pressure on the asset's price in the future.
The up/down arrows are landmarks of the possible price direction in the future.
Díky analytickým přehledům společnosti InstaForex získáte plné povědomi o tržních trendech! Jako zákazníkovi společnosti InstaForex je Vám k dispozici velký počet bezplatných služeb umožňujících efektivní obchodování.


