 Zůstat
Obchodní podmínky
Nástroje


In February this year, the producer price index in the eurozone fell by 0.5% compared to the previous month, and growth in annual terms slowed to 13.2% from the previous 15.1%.
However, it is worth noting that economists had forecast a weaker decline in producer prices of 0.3% MoM and a higher growth of 13.3% YoY.
The market was strongly influenced by the JOLTS data on job openings in the U.S. labor market for February. According to the Department of Labor's monthly survey, the number of open jobs fell by 632,000 to 9.93 million, down from a revised 10.56 million in January. The sharp drop in job openings has fueled fears of a recession in the U.S. economy.
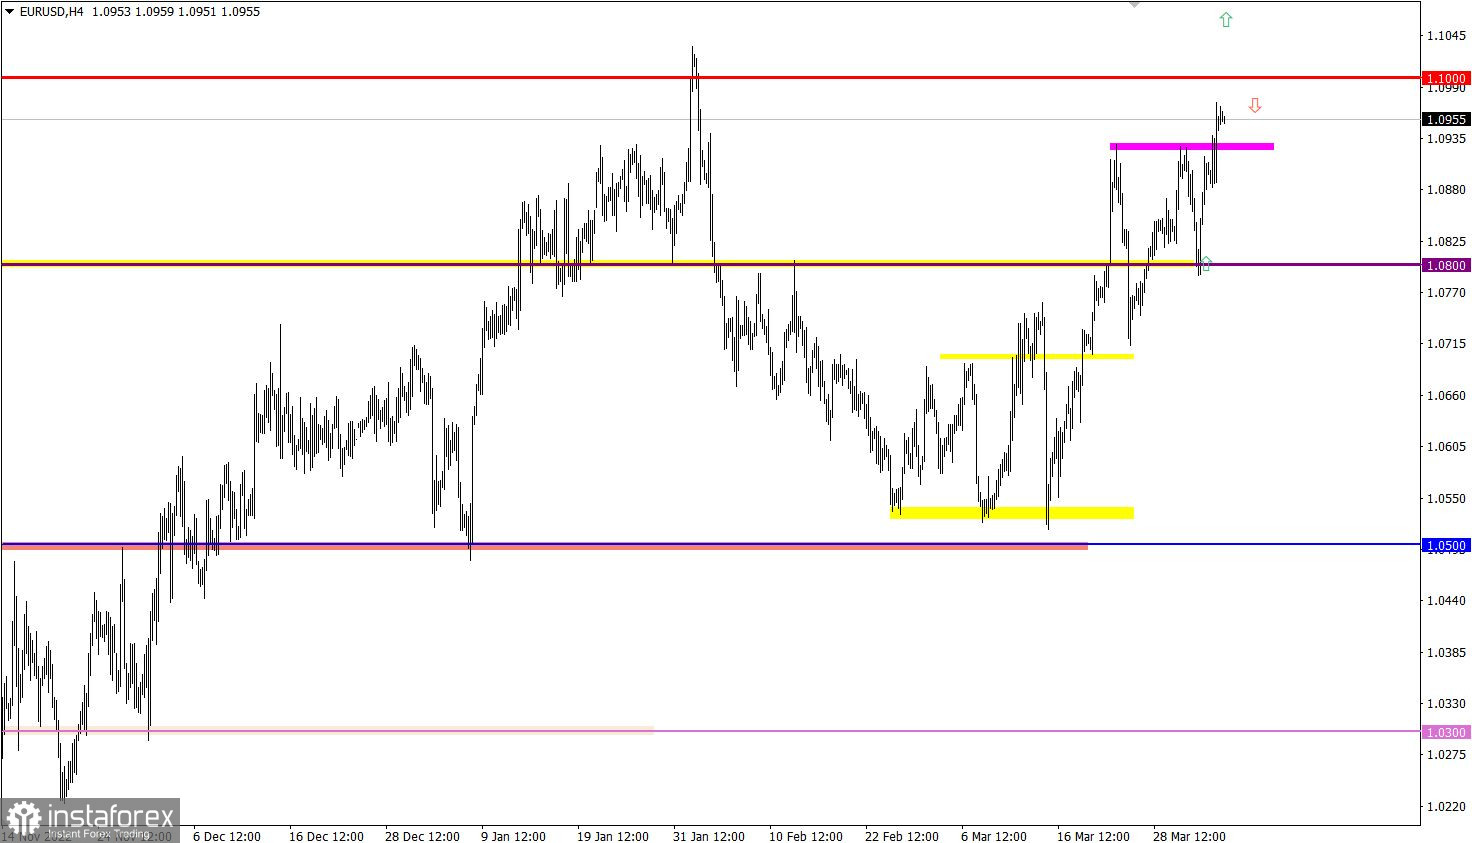
EUR/USD updated its weekly high, which increased the volume of long positions in the market. The euro's recovery from February's slump is almost complete, and there is less than 70 pips to the high of the medium-term upward trend.
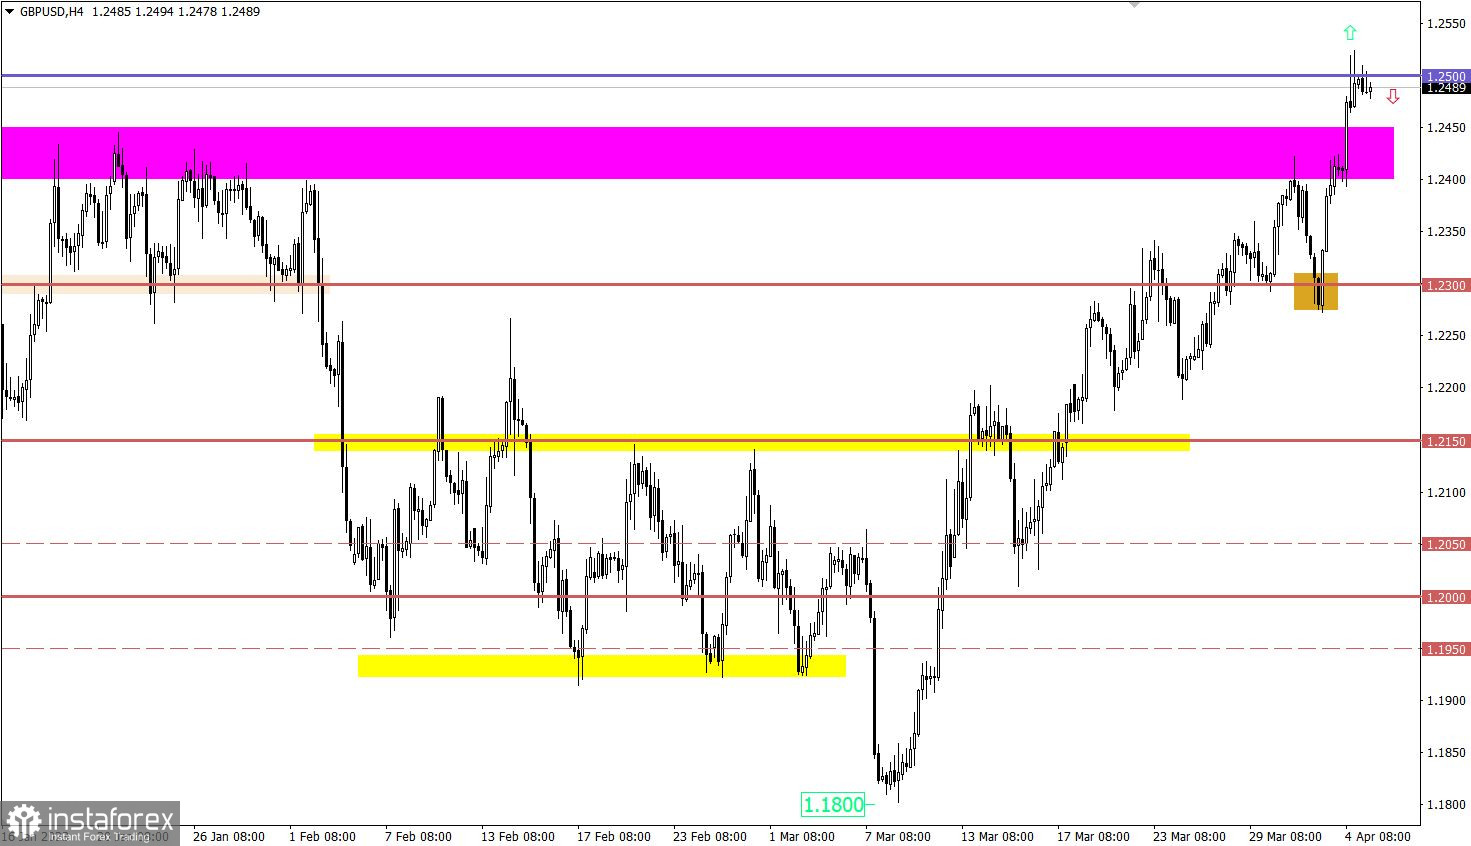
GBP/USD also updated the local high of the medium-term upward trend due to the rapid inertial movement. Since the beginning of the upward trend cycle, sterling has strengthened by about 6%, which is about 720 pips in 20 trading days.

The publication of the final data on the indices of business activity in the service sector and the composite index in Europe, the United Kingdom, and the United States is expected today. If the data coincides or nearly coincides with the preliminary estimates, the market should not react to it.
During the U.S. trading session, the ADP report on the U.S. employment rate will be released, which is estimated to rise by 200,000 people. The ADP report is often seen by traders as a leading indicator for the U.S. Labor Department report.
Time targeting:
EU Services PMI (September) – 08:00 UTC
UK Services PMI (September) – 08:30 UTC
ADP report – 12:15 UTC
U.S. Services PMI (September) – 13:45 UTC
The area of the 1.1000 psychological level acts as a resistance on the path of buyers, from which a correction occurred in February and relative to which the quote is currently recovering. If the pattern of the past associated with this level repeats, it is possible to reduce the volume of long positions, which may lead to a pullback. However, if the price holds above 1.1050 throughout the day, it will indicate the continuation of the medium-term upward trend.
The 1.2500 level acts as a resistance on the way of buyers, and the price has already reached its level. According to technical analysis, a pullback may appear on the market due to the overbought pound sterling and the 1.2500 resistance level. However, if the price is consistently held above the reference level throughout the day, speculators may ignore the signals from technical analysis, and the current inertial course will continue.
The candlestick chart type is white and black graphic rectangles with lines above and below. With a detailed analysis of each individual candle, you can see its characteristics relative to a particular time frame: opening price, closing price, intraday high and low.
Horizontal levels are price coordinates, relative to which a price may stop or reverse its trajectory. In the market, these levels are called support and resistance.
Circles and rectangles are highlighted examples where the price reversed in history. This color highlighting indicates horizontal lines that may put pressure on the asset's price in the future.
The up/down arrows are landmarks of the possible price direction in the future.
Díky analytickým přehledům společnosti InstaForex získáte plné povědomi o tržních trendech! Jako zákazníkovi společnosti InstaForex je Vám k dispozici velký počet bezplatných služeb umožňujících efektivní obchodování.


