 Zůstat
Obchodní podmínky
Nástroje


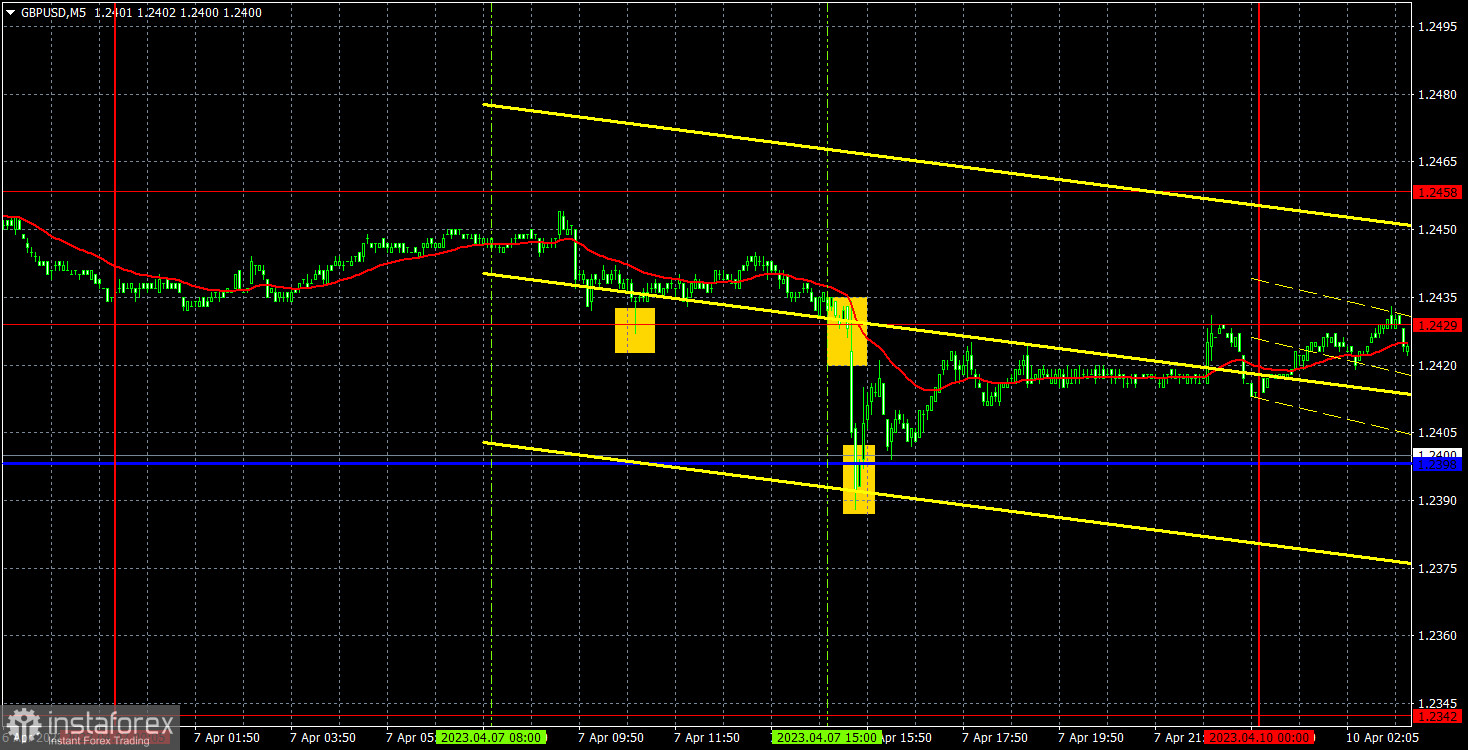
On Friday, GBP/USD also spent most of the day trading sideways following all the movements of EUR/USD. Therefore, there is nothing new to say about the sterling now. There were no important events or publications in the UK throughout the past week. Traders are still poised to go long on GBP/USD. The pound has already advanced by 700 points, but it still doesn't want to correct downward and can't even go below the critical line, although it has already approached the current price. On Friday, the US dollar asserted its strength across the board for obvious reasons. There are no fundamentals for the greenback's strength today. We still expect a sharp drop in the pound, but the market expresses an unreasonable bullish sentiment, so the pair may also extend its growth this week. In addition, volatility has calmed down in recent days. As a result, we get weak movements, unreasonable market responses, and protracted growth of the sterling, which can stop at any moment. All in all, GBP/USD is technically unpredictable.
The instrument generated three trading signals on Friday, but they could all be safely neglected. A sell signal popped up in the early trading hours of the New York session because no one could say in advance what the US macroeconomic statistics would be like. The price bounced off the critical line because the statistics turned out to be upbeat, so the US dollar's growth was more realistic than the pound's growth. The first signal was formed as a bounce off 1.2429 because there were only 29 points left to the nearest target level.
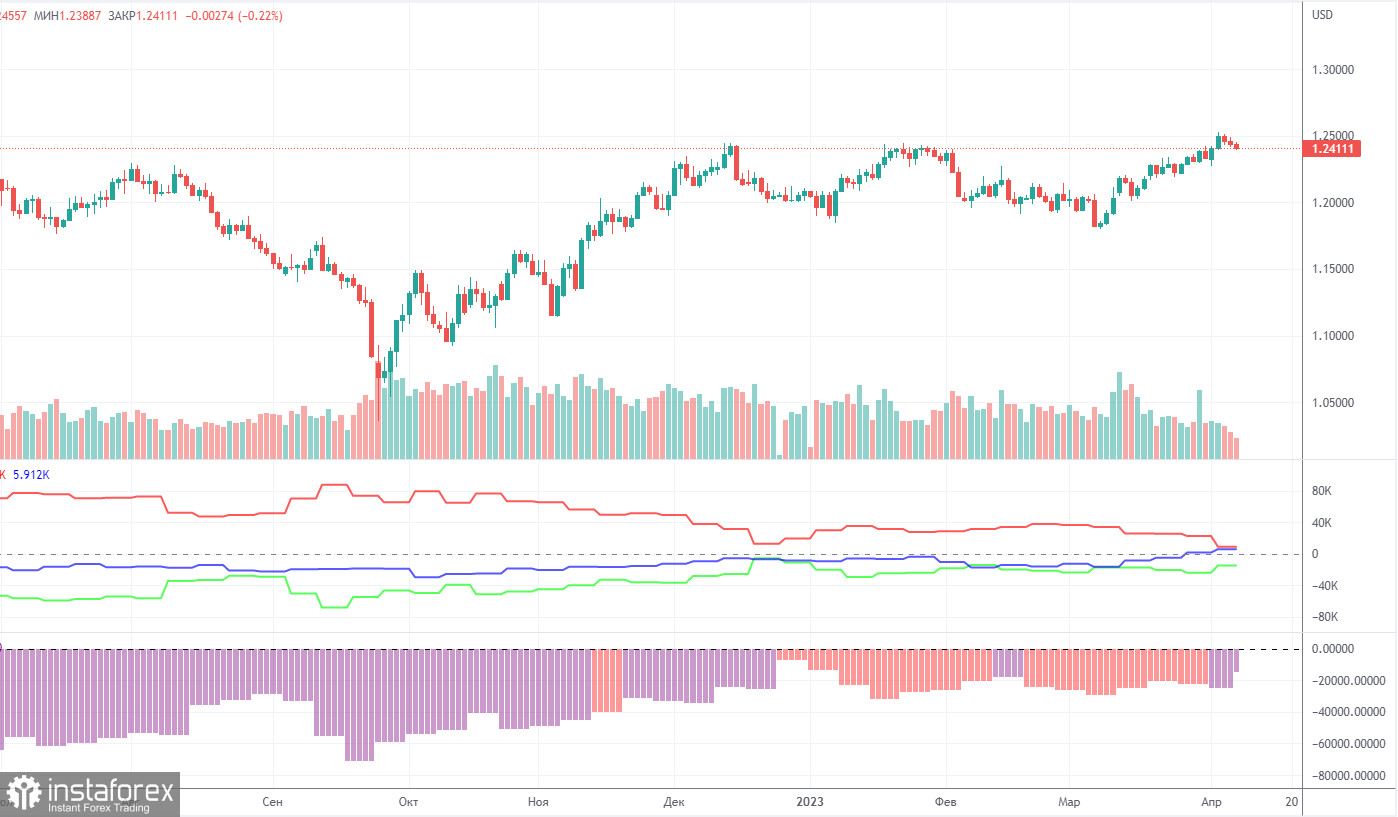
COT reports for the British pound are again released in a due time. The latest available report is for April 4th. According to this report, the Non-commercial group opened 18,000 BUY contracts and also opened 8,800 SELL contracts. As a result, the net position of non-commercial traders increased by 9,200 and continues to grow. The net position indicator has been steadily growing for the past 7-8 months, but the sentiment of major players remains bearish. Although the pound sterling is growing against the US dollar in the medium term, it is very difficult to figure out the reasons for the sterling's rally from a fundamental point of view. We absolutely do not exclude the scenario in which a sharper drop in the pound will begin in the short term. Formally, it has already started, but so far this movement looks more like a flat market. We also note that both major pairs are currently following roughly the same pattern, but the net position for the euro is positive and even implies a soon-to-be-ending upward impulse, while for the pound, it is negative, which suggests further growth. The British currency has already rallied by 2,100 points. It is stunning growth without a strong downward correction, so a further rally will be absolutely illogical. The Non-commercial group now holds a total of 61,000 sell contracts and 46,000 buy contracts open. We are still skeptical about the long-term uptrend of the British currency and expect it to fall.
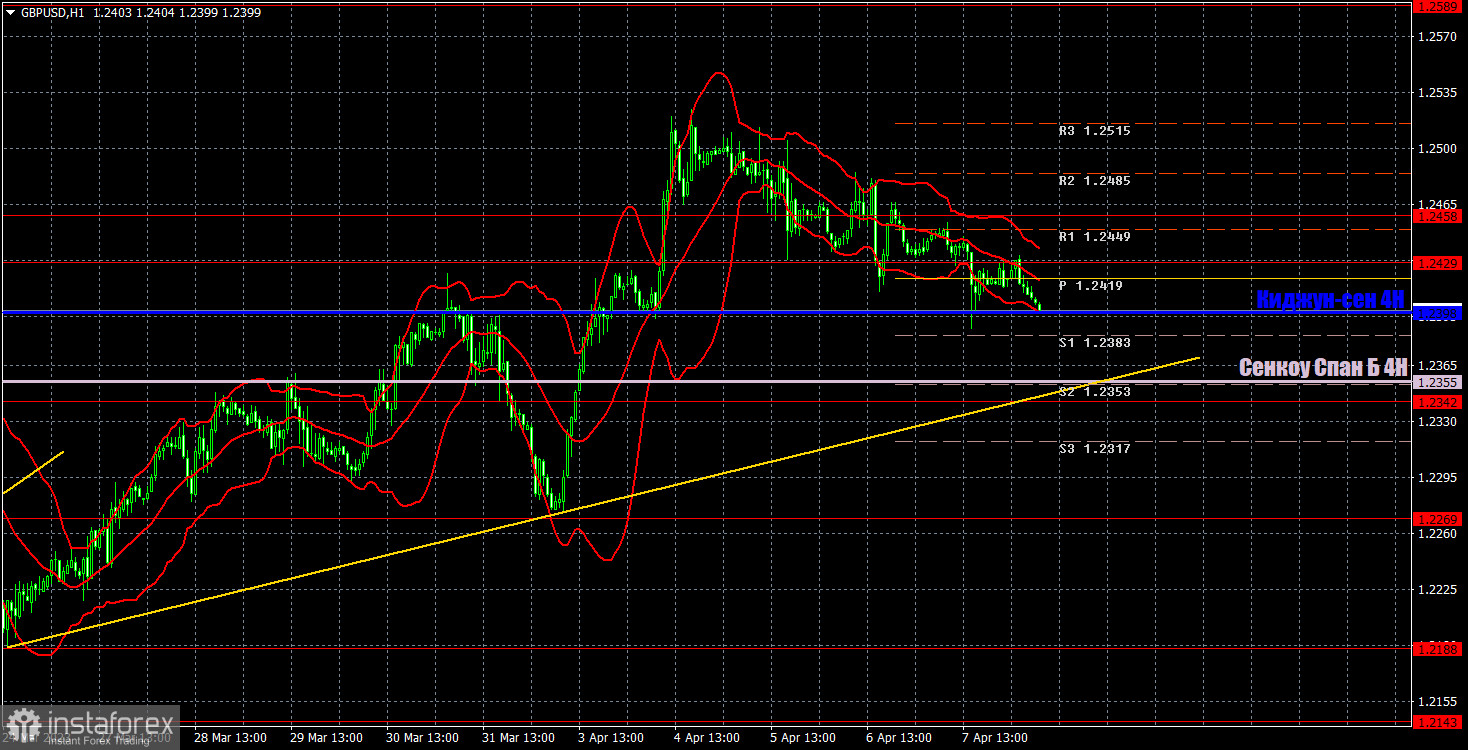
On the 1-hour timeframe, GBP/USD maintains a new uptrend, although it has been correcting over the past few days. There are still no fundamentals for the British pound to grow, but market participants are neglecting this fact. Therefore, the instrument may well resume its upward move, even though there are no fundamental reasons for it. After the level of 1.2440 was broken, the pair exited the three-month sideways channel, but the channel itself may still be valid. A new trend line has been formed, which is not of particular importance. The price is above the Ichimoku indicator lines. So far, the technical picture suggests a further advance of the pound sterling. For April 10, we highlight the following important levels: 1.1927, 1.1965, 1.2143, 1.2185, 1.2269, 1.2342, 1.2429-1.2458, 1.2589, 1.2659, and 1.2762. Senkou Span B (1.2355) and Kijun-sen (1.2398) lines can also be sources of signals. Signals can be "bounces" and "breakthroughs" of these levels. It is recommended to set the Stop Loss level at breakeven when the price moves in the right direction by 20 points. The Ichimoku indicator lines may shift during the day, which should be taken into account when identifying trading signals. There are also support and resistance levels in the picture that can be used to fix profits on trades. On Monday, no significant events are scheduled in the UK and the US. Thus, GBP/USD is set to trade with low volatility. Its movements may be chaotic and non-trending.
Support and resistance levels are plotted by thick red lines, near which the movement may end. Commonly, they do not generate trading signals.
The Kijun-sen and Senkou Span B lines are the Ichimoku indicator lines transferred to the 1-hour timeframe from the 4-hour timeframe. They are strong lines.
Extreme levels are thin red lines, from which the price bounced or dropped earlier. They are sources of trading signals.
Yellow lines are trend lines, trend channels, and any other technical patterns.
Indicator 1 on the COT charts is the size of the net position of each category of traders.
Indicator 2 on the COT charts is the size of the net position for the Non-commercial group.
Díky analytickým přehledům společnosti InstaForex získáte plné povědomi o tržních trendech! Jako zákazníkovi společnosti InstaForex je Vám k dispozici velký počet bezplatných služeb umožňujících efektivní obchodování.

