 Zůstat
Obchodní podmínky
Nástroje


On Monday, the macroeconomic calendar was empty in the European Union, the United Kingdom and the United States, which did not provide investors and traders with important statistical data for decision-making in the market.
In this regard, they focused on the news flow. And the interview with European Central Bank Executive Board member Isabel Schnabel was published in Politico, in which she did not rule out an interest rate hike of 50 basis points.
"It's clear that further rate hikes are needed, but the size of the rate hikes is going to depend on the incoming data," Politico quoted Schnabel. "Data dependence means that 50 basis points are not off the table."
Such a statement about the possible tightening of the European Central Bank's monetary policy instantly affected the euro exchange rate, leading to its strengthening.
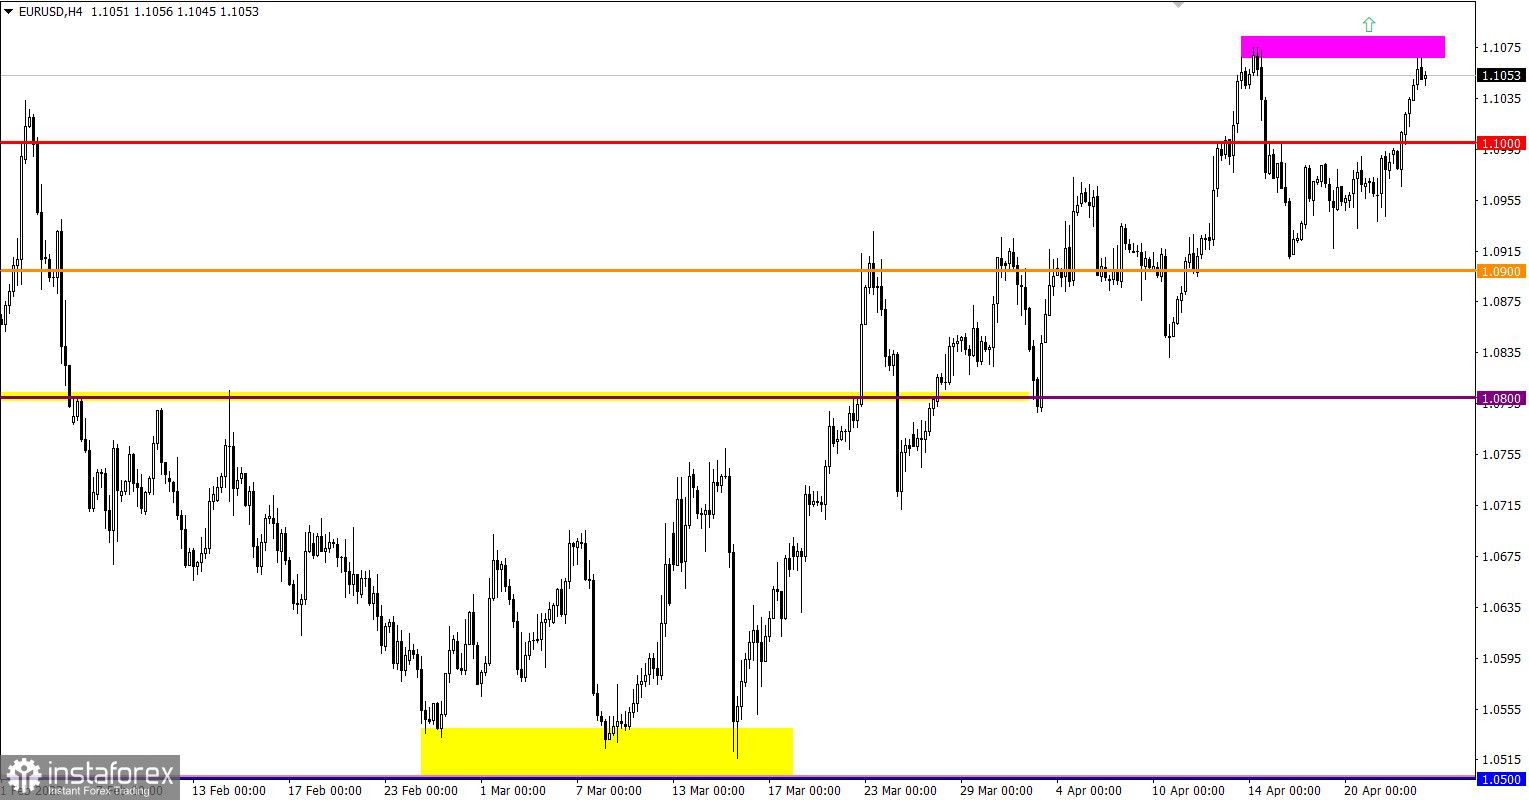
The weekly stagnation of the EUR/USD pair was interrupted by an upward impulse, which led to an increase in the volume of long positions and a successful overcoming of the control level of 1.1000. The euro rate returned to the area of the local high of the medium-term upward trend.
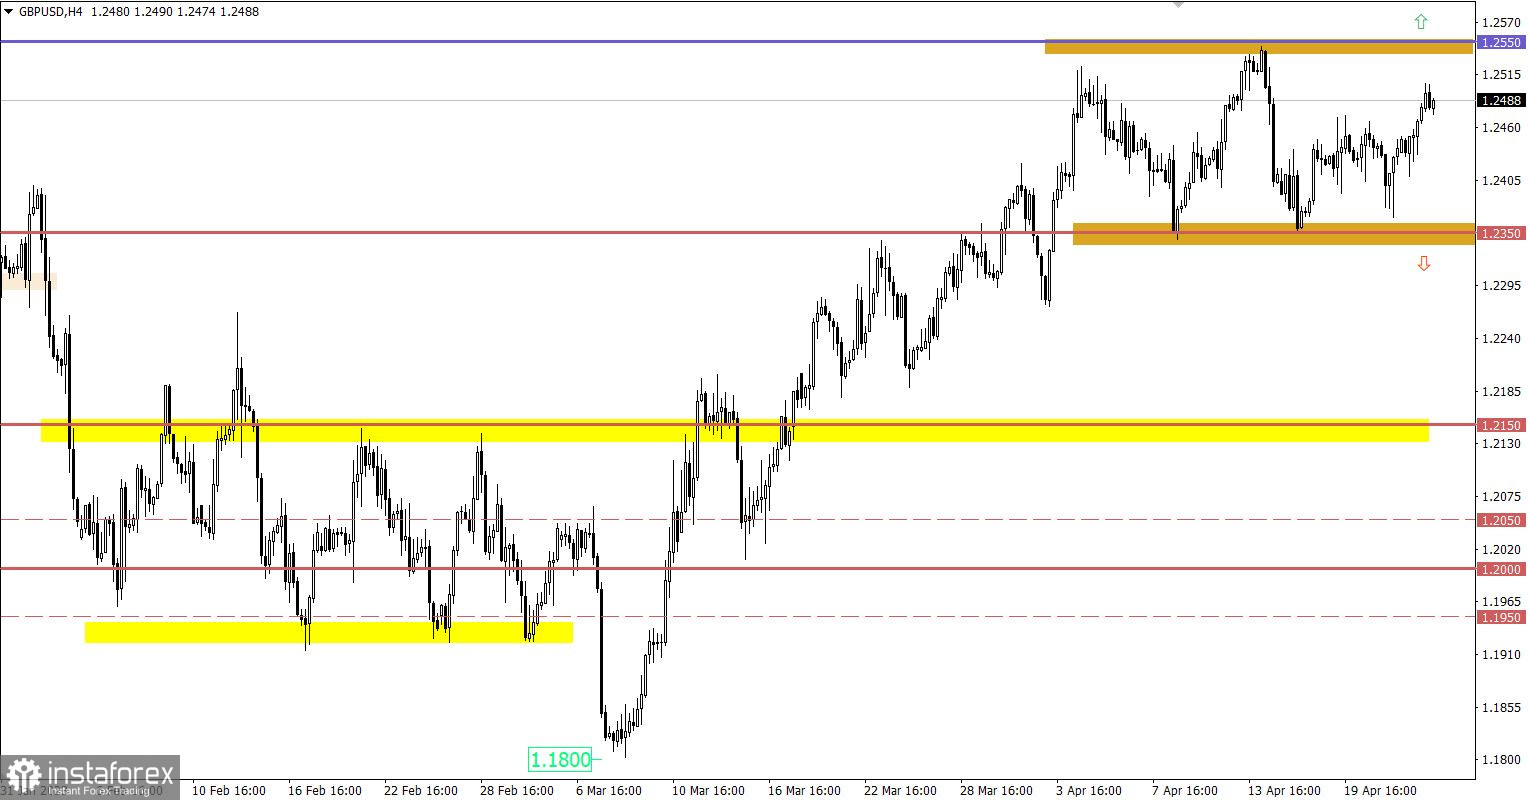
Meanwhile, the GBP/USD pair has been moving within the sideways range of 1.2350/1.2550 for the third week in a row. The recent price change did not lead to significant shifts, and the quote only approached the upper limit of the range.

Today, the publication of statistical data on the real estate market in the United States is expected. Forecasts suggest a slowdown in the pace of housing price growth and a decrease in new home sales. This data may lead to a slight weakening of the dollar.
It is likely that the price range of 1.1060/1.1080 will have a negative impact on the volume of long positions, which may lead to a reduction in positions and a price pullback. However, the return of the quote to the area of the medium-term trend's high indicates a continuing upward tendency among market participants. Therefore, holding the price above the 1.1100 level may lead to a continuation of the upward cycle.
Since the movement is within the range, the trading strategy remains unchanged: bounce or breakout relative to the flat boundaries.
To clarify the above:
The bounce tactic is used when the price approaches the boundary of the range.
The breakout method is the primary strategy, as it can indicate the future direction of the price.
The candlestick chart type is white and black graphic rectangles with lines above and below. With a detailed analysis of each individual candle, you can see its characteristics relative to a particular time frame: opening price, closing price, intraday high and low.
Horizontal levels are price coordinates, relative to which a price may stop or reverse its trajectory. In the market, these levels are called support and resistance.
Circles and rectangles are highlighted examples where the price reversed in history. This color highlighting indicates horizontal lines that may put pressure on the asset's price in the future.
The up/down arrows are landmarks of the possible price direction in the future.
Díky analytickým přehledům společnosti InstaForex získáte plné povědomi o tržních trendech! Jako zákazníkovi společnosti InstaForex je Vám k dispozici velký počet bezplatných služeb umožňujících efektivní obchodování.


