 Zůstat
Obchodní podmínky
Nástroje


On Tuesday, the macroeconomic calendar was empty, with no significant statistical data published in Europe, the United Kingdom, or the United States.
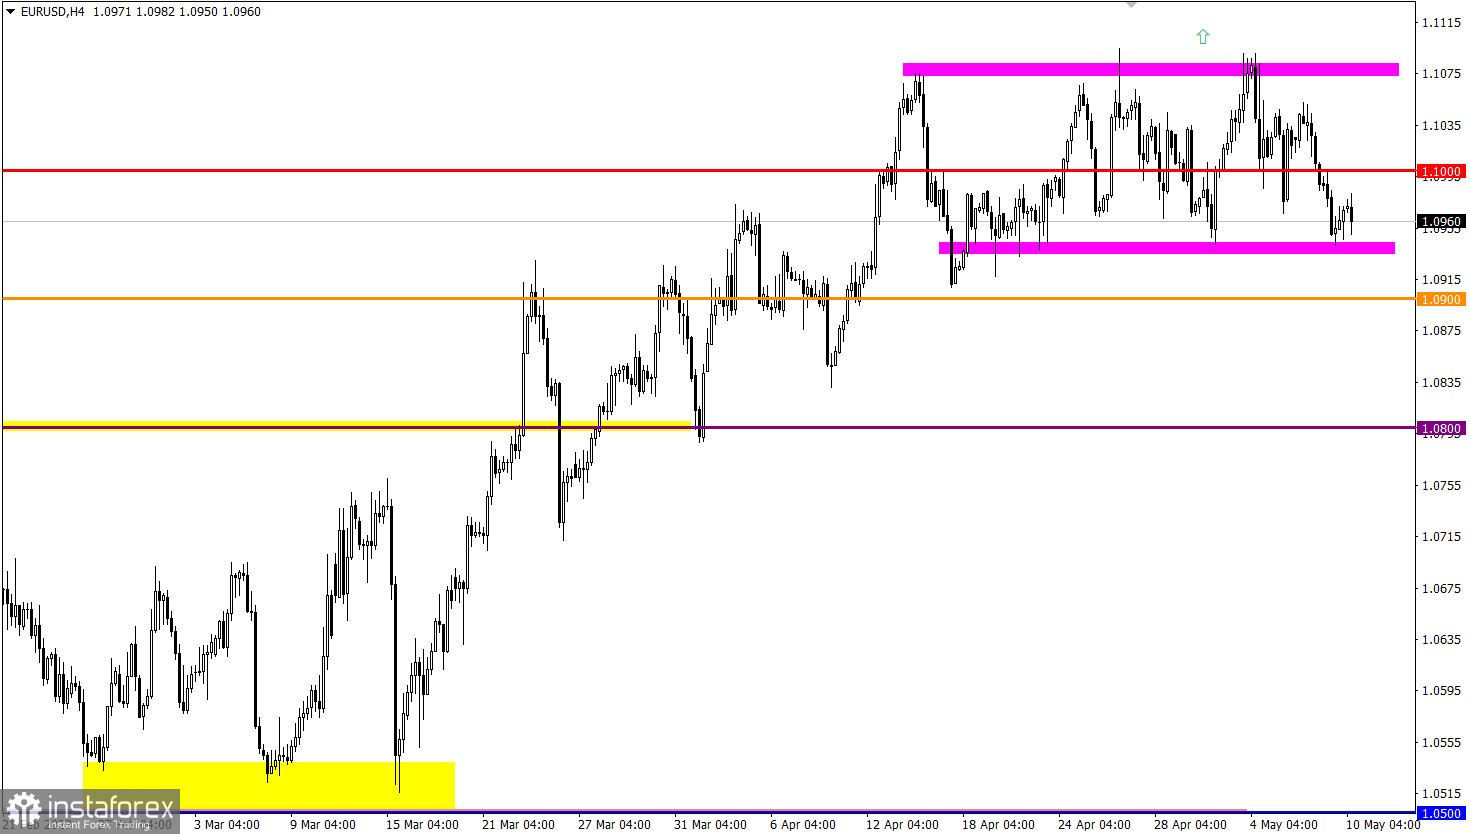
The EUR/USD pair has lost about 1.3% from the peak of the medium-term trend. However, no radical changes are observed on the trading chart. The quote has been moving within the range of 1.0950/1.1100 for the third week in a row, consistently working through the set boundaries.
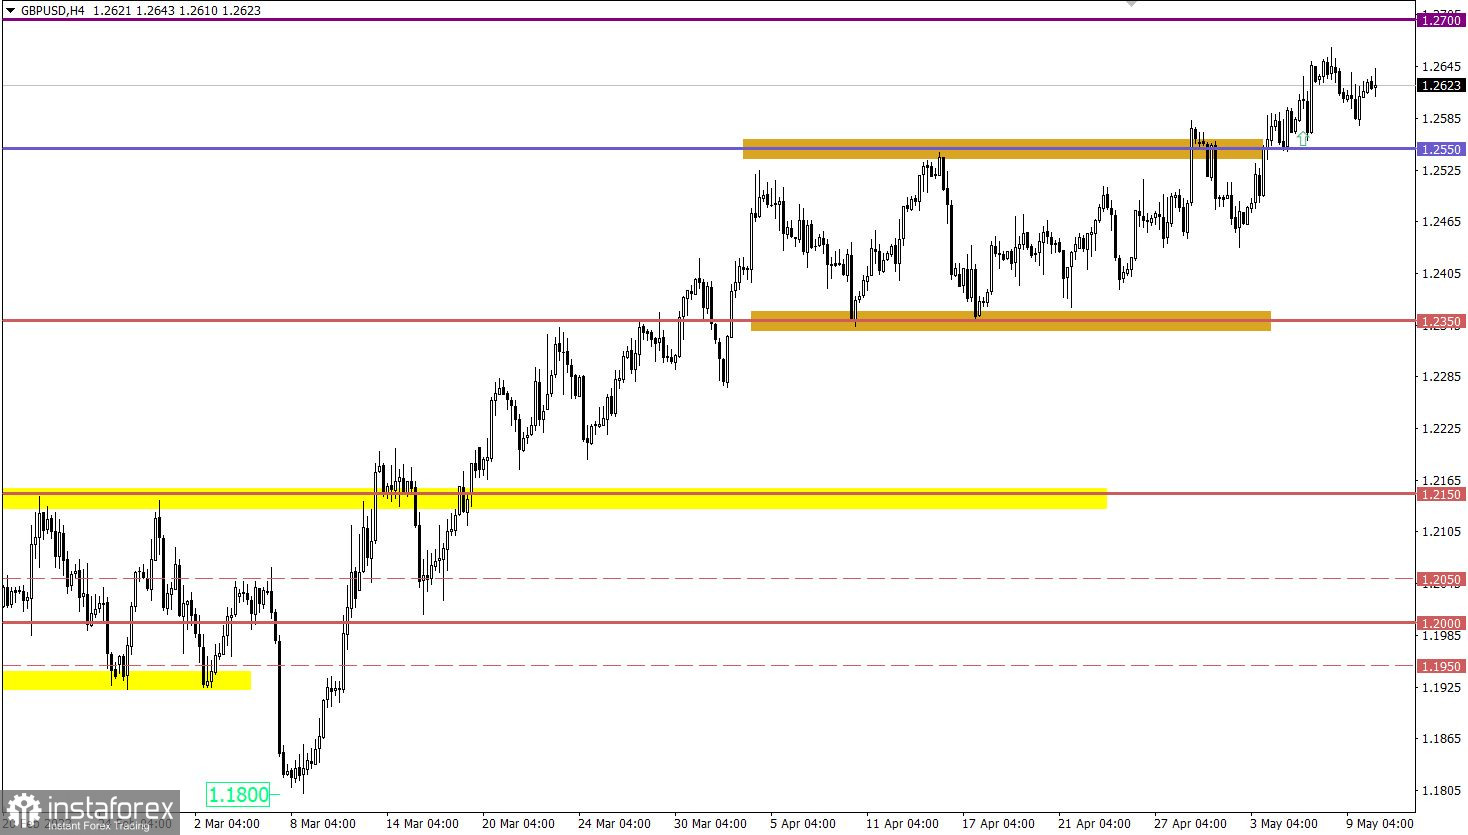
The GBP/USD pair has slightly retreated from the local high, while the upward sentiment remains among market participants.

Today, the market's focus is on inflation data in the United States. The consumer price growth rate is expected to slow down from 5.0% to 4.9%. This would serve as a kind of confirmation that the Federal Reserve will take a break in the interest rate hike cycle at the upcoming meeting in June.
This factor may lead to a weakening of dollar positions in the market.
Time targeting:
U.S. Inflation – 12:30 UTC
It can be assumed that the movement within the given range will persist in the market, where it is possible to apply two strategies at once: breakout or rebound relative to the set boundaries.
In case of considering a rebound tactic, it is necessary to wait for the price to hold beyond one or another boundary in the daily period. In this case, a technical signal about the subsequent price direction may arise.
For a technical signal of a prolongation of the medium-term upward trend to appear, the quote needs to return above the level of 1.2650. Otherwise, the retracement stage will still persist in the market for some time, allowing for a weakening of the euro rate towards 1.2550.
The candlestick chart type is white and black graphic rectangles with lines above and below. With a detailed analysis of each individual candle, you can see its characteristics relative to a particular time frame: opening price, closing price, intraday high and low.
Horizontal levels are price coordinates, relative to which a price may stop or reverse its trajectory. In the market, these levels are called support and resistance.
Circles and rectangles are highlighted examples where the price reversed in history. This color highlighting indicates horizontal lines that may put pressure on the asset's price in the future.
The up/down arrows are landmarks of the possible price direction in the future.
Díky analytickým přehledům společnosti InstaForex získáte plné povědomi o tržních trendech! Jako zákazníkovi společnosti InstaForex je Vám k dispozici velký počet bezplatných služeb umožňujících efektivní obchodování.

