 Zůstat
Obchodní podmínky
Nástroje


Weak UK labor market data had a negative impact on the British pound and the European currency. The unemployment rate increased from 3.8% to 3.9%, which led to a weakening of the pound sterling and, consequently, the euro.
In the European Union, the second estimate of GDP for the first quarter was published, which fully coincided with the initial estimate. These data were already factored into the market.
During the American trading session, retail sales data in the United States were published, which increased by 0.4% in April compared to the previous month. This was lower than economists' expectations, who predicted a growth of 0.8%. In March, the figure dropped by 0.7%. However, data on industrial production in the U.S. in April unexpectedly increased by 0.5% compared to the previous month. In annual terms, the volume of industrial production in the U.S. in April increased by 0.2% after growing by 0.1% in the previous month. The U.S. dollar reacted positively to these statistical data, which led to a strengthening of its value.

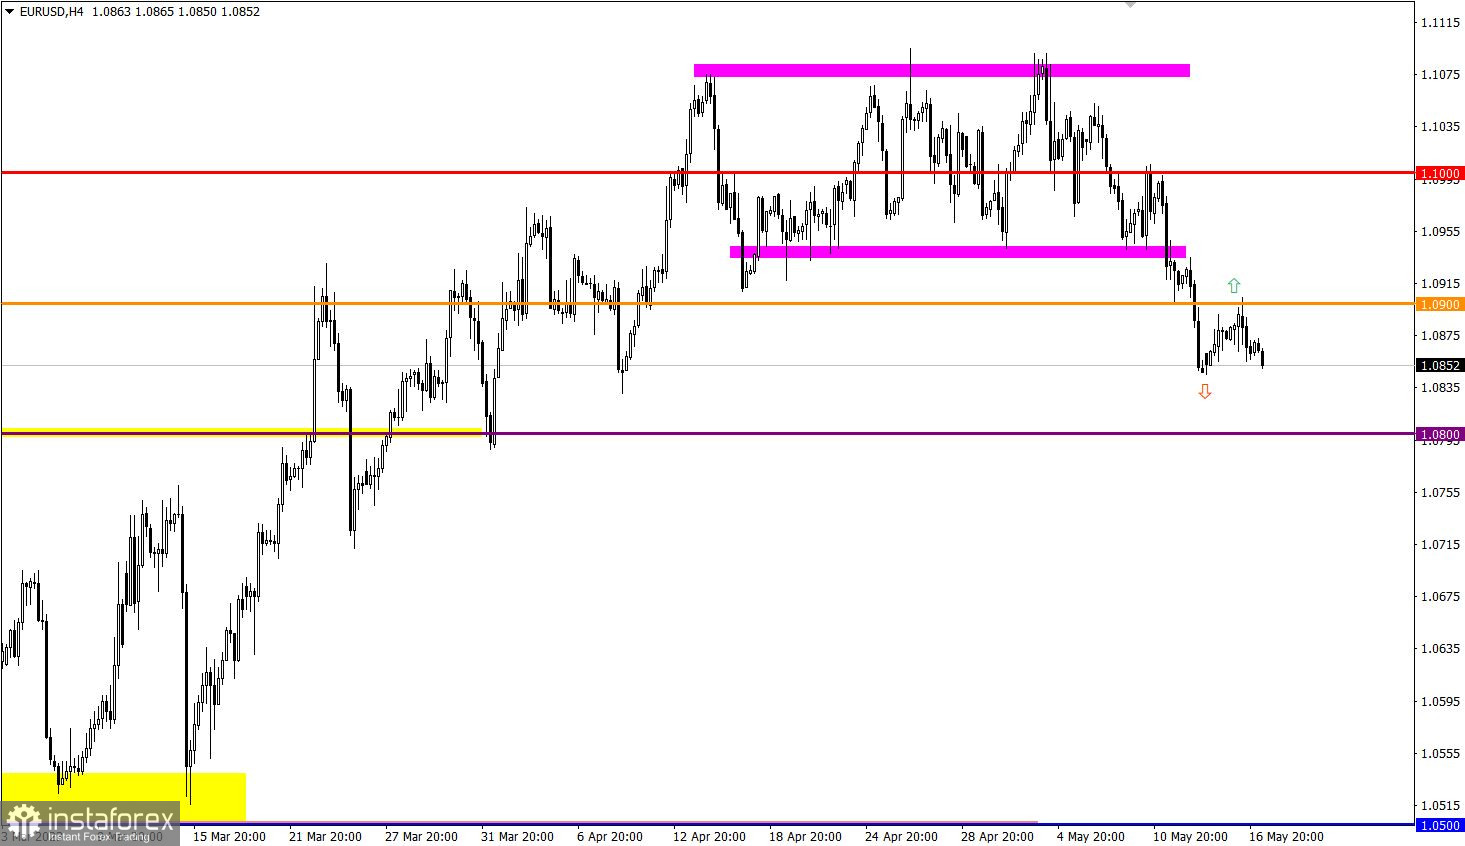
EUR/USD failed to overcome the 1.0900 level, and instead, there was a rebound, accompanied by an increase in the volume of short positions.
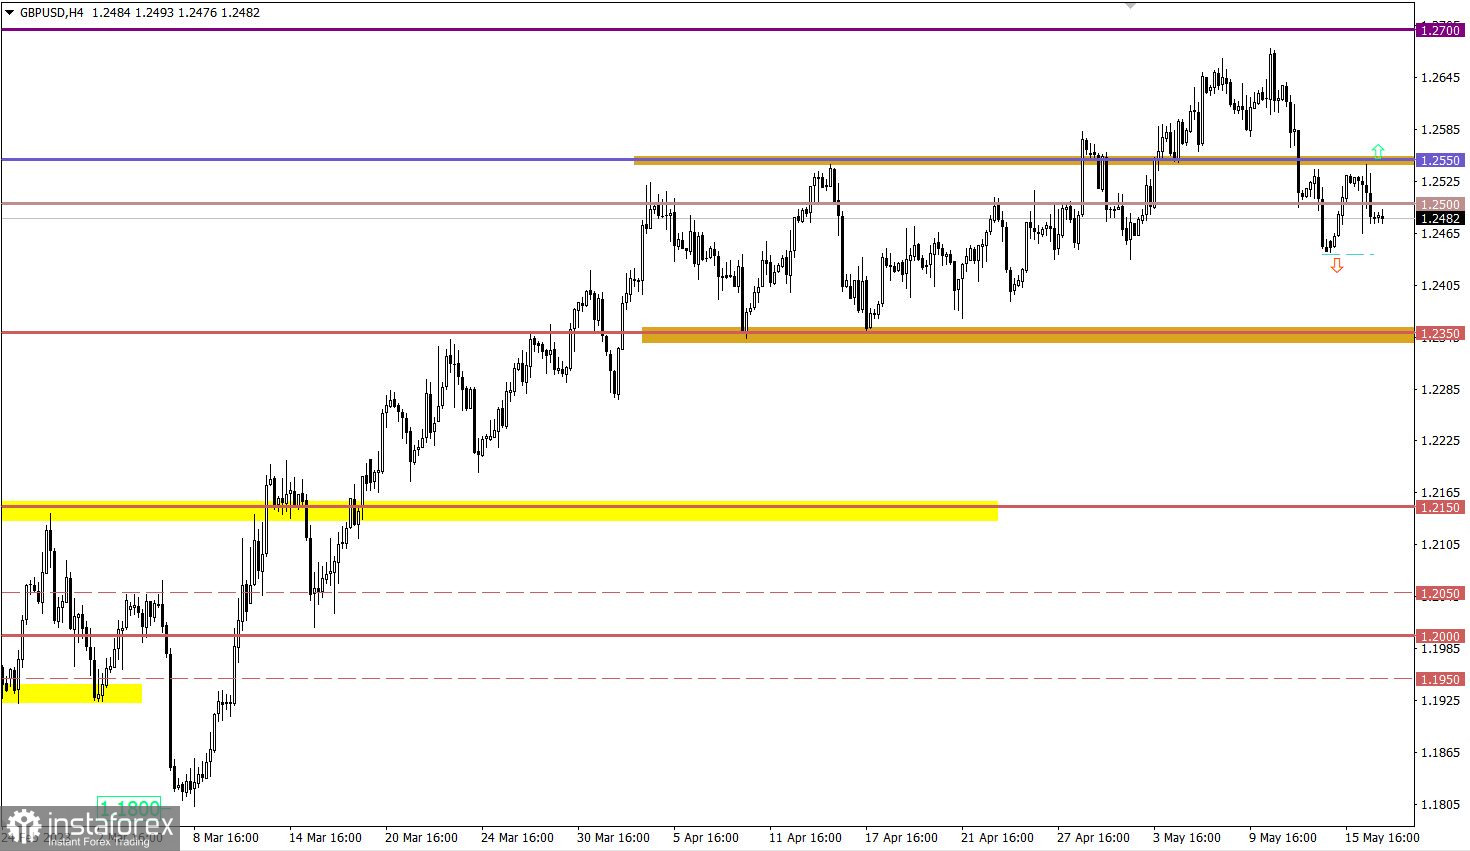
Despite high volatility, GBP/USD failed to overcome the control value of 1.2550. As a result, a pullback occurred, which lowered the quote below the level of 1.2500.
At the moment, the only significant event is the publication of final inflation data in the European Union. However, these data will mostly confirm the preliminary estimates, so the market does not expect a significant reaction to them. However, in case of discrepancies between expected and actual indicators, speculative activity is possible.
Time targeting:
EU Inflation – 09:00 UTC
In this situation, sellers are exerting pressure, which could lead to the subsequent formation of a corrective move. However, a full-fledged technical signal to confirm this theory will only arise after holding the price below the 1.1840 level. For now, fluctuations in the range of 1.0850/1.0900 are possible.
The steady holding of the price below the level of 1.2500 increases the likelihood of a subsequent decrease, opening the possibility for updating the local low of the corrective move. As for the upward trend scenario, for it to be considered, it requires not only a return above 1.2500, but also a retention of the quote above 1.2550 for at least a four-hour period.
The candlestick chart type is white and black graphic rectangles with lines above and below. With a detailed analysis of each individual candle, you can see its characteristics relative to a particular time frame: opening price, closing price, intraday high and low.
Horizontal levels are price coordinates, relative to which a price may stop or reverse its trajectory. In the market, these levels are called support and resistance.
Circles and rectangles are highlighted examples where the price reversed in history. This color highlighting indicates horizontal lines that may put pressure on the asset's price in the future.
The up/down arrows are landmarks of the possible price direction in the future.
Díky analytickým přehledům společnosti InstaForex získáte plné povědomi o tržních trendech! Jako zákazníkovi společnosti InstaForex je Vám k dispozici velký počet bezplatných služeb umožňujících efektivní obchodování.


