 Zůstat
Obchodní podmínky
Nástroje


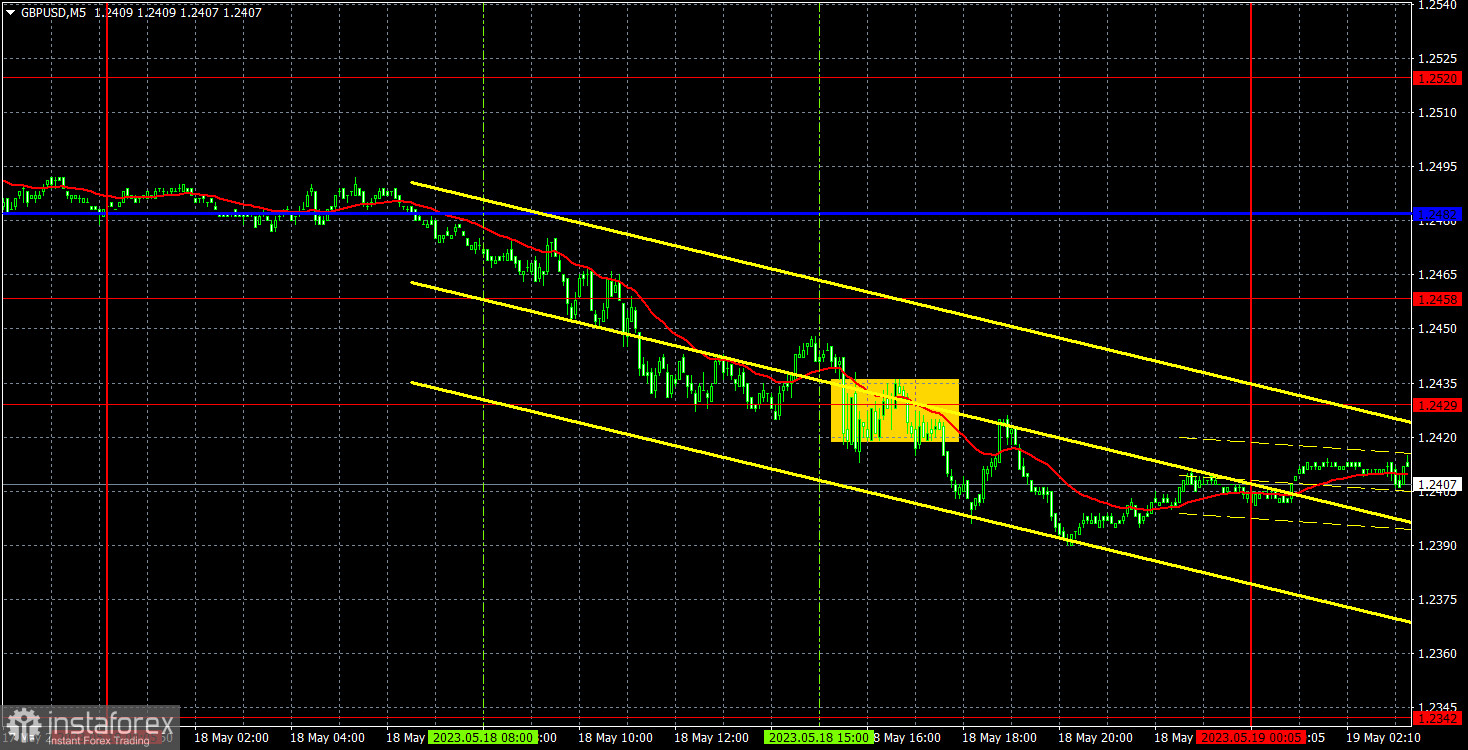
Yesterday, GBP/USD extended losses despite two attempts to break through the range of 1.2429-1.2445. However, the level was broken only on the third attempt. Therefore, we will likely see a bearish continuation. That is also due to a prolonged rise that preceded the current fall. That is why no matter the fundamental and macroeconomic factors, quotes will continue posting losses. The macroeconomic calendar of the UK was empty yesterday. So, traders focused on US data, which came better than expected and slightly boosted the dollar.
The movement began in the morning. But the price was then trapped in the 1.2482-1.2458-1.2429 range. Trading made no sense because when a signal came, the price instantly approached another level where a bounce could happen. A sell signal was generated near 1.2429, where traders considered opening positions. However, losses, in that case, would exceed potential profits. If something went wrong, the signal would be canceled after consolidation above the key line only. Therefore, it is so important to trade cautiously when the price is in such a wide range.
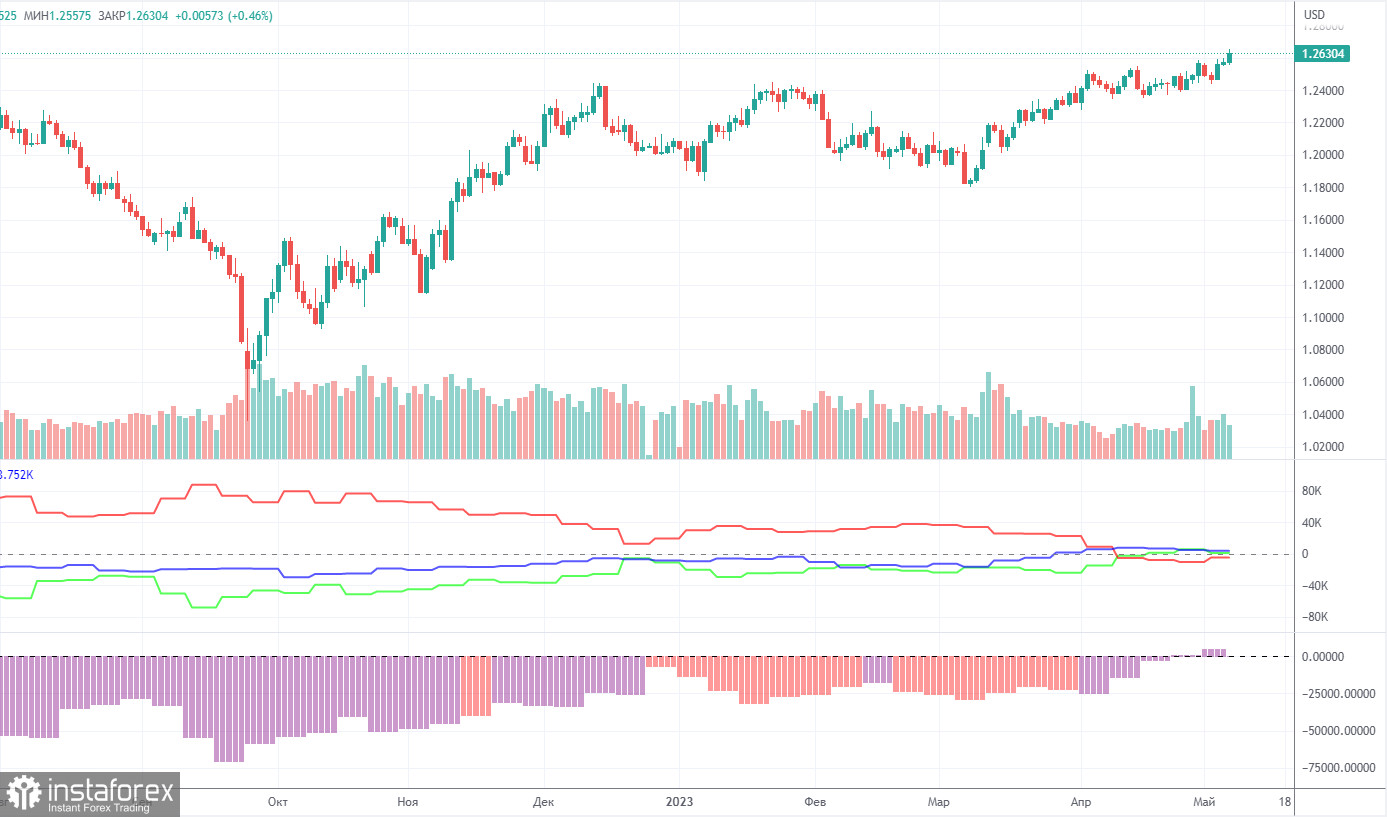
According to the latest report, non-commercial traders opened 12,900 long positions and 9,500 short ones. The net positions grew by 3,400 and remained bullish. Over the past 9 months, the net position has been on the rise despite bearish sentiment The pound is bullish against the greenback in the medium term, and fundamentals hardly explain that. We do not rule out a possibility of a fall in the near term. In fact, it may have already begun.
Both major pairs are in correlation now. At the same time, the positive net position on EUR/USD indicates an impending reversal. Meanwhile, the neutral net position on GBP/USD illustrates a bullish continuation. The pound has gained about 2,300 pips. Therefore, a bearish correction is now needed. Overall, non-commercial traders hold 67,000 sell positions and 71,500 long ones. We do not see the pair extending growth in the long term.
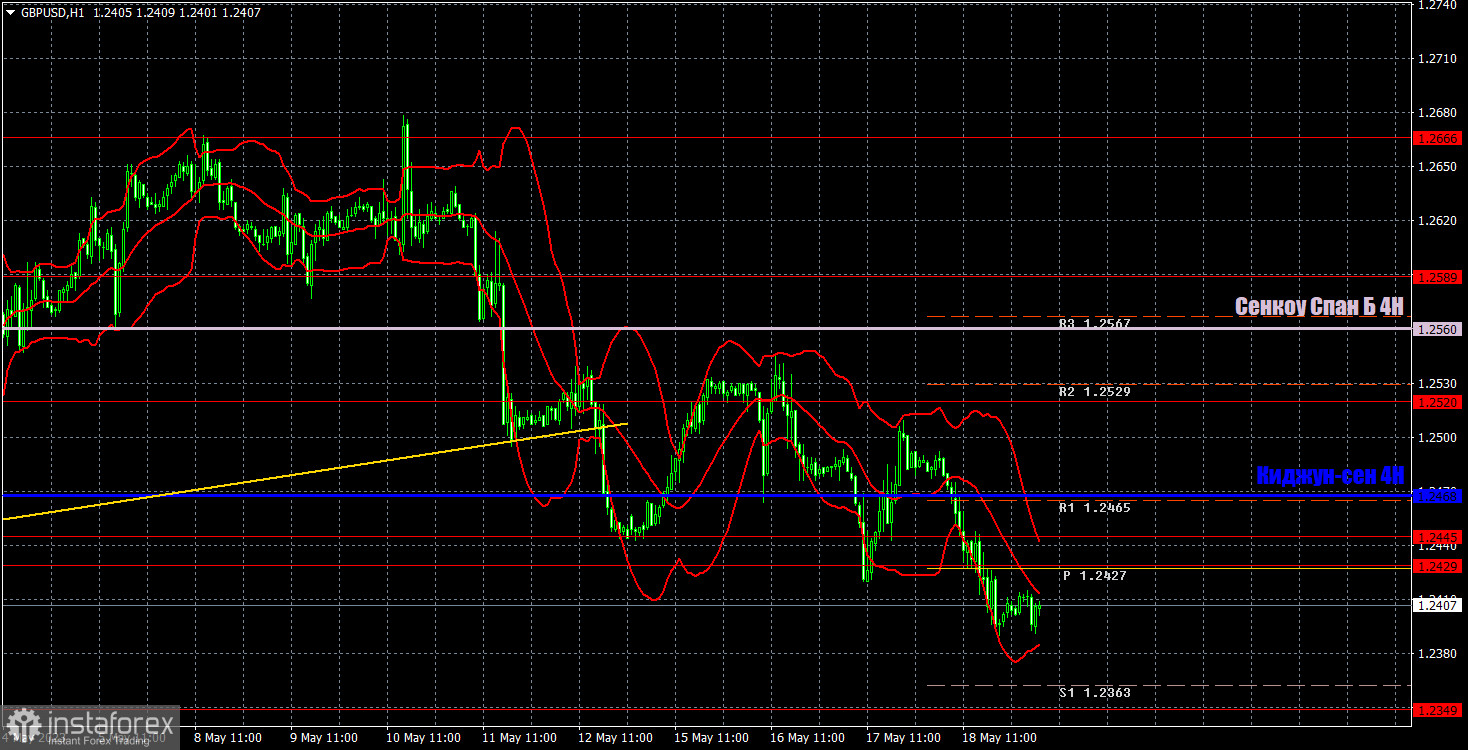
In the H1 time frame, GBP/USD has broken the ascending trendline. The bear movement continues. The price is below the Ichimoku indicator. There have been almost no fundamental factors this week, and the pair kept falling. We will likely see a bearish continuation.
On May 19, trading levels are seen at 1.2269, 1.2349, 1.2429-1.2445, 1.2520, 1.2589, 1.2666, and 1.2560. The Senkou Span B (1.2560) and Kijun-sen (1.2468) may also generate signals when the price either breaks or bounces off them. A Stop Loss should be placed at the breakeven point when the price goes 20 pips in the right direction. Ichimoku indicator lines can move intraday, which should be taken into account when determining trading signals. There are also support and resistance which can be used for locking in profits.
The macroeconomic calendar of the UK will be empty on Friday. In the US, Fed Chair Powell will speak.
Resistance/support - thick red lines, near which the trend may stop. They do not make trading signals.
The Kijun-sen and Senkou Span B lines are the Ichimoku indicator lines moved to the hourly timeframe from the 4-hour timeframe. They are also strong lines.
Extreme levels are thin red lines, from which the price used to bounce earlier. They can produce trading signals.
Yellow lines are trend lines, trend channels, and any other technical patterns.
Indicator 1 on the COT chart is the size of the net position of each trader category.
Indicator 2 on the COT chart is the size of the net position for the Non-commercial group of traders.
Díky analytickým přehledům společnosti InstaForex získáte plné povědomi o tržních trendech! Jako zákazníkovi společnosti InstaForex je Vám k dispozici velký počet bezplatných služeb umožňujících efektivní obchodování.


