 Zůstat
Obchodní podmínky
Nástroje


GBP/USD was bullish on Friday without any driving factors. The pair has shown impressive growth in recent weeks. Nevertheless, the pound's rise is hard to explain. We can only assume that the market strongly believes that due to high inflation, the Bank of England will be raising interest rates for a long time. In 2007-2008, the Bank of England raised its rate to nearly 6%. So, the market is anticipating a similar move this time. There are simply no other explanations for a stronger pound.
Therefore, we can conclude that it is rising ahead of the Bank of England's meeting, rather than the Federal Reserve's meeting, which will take place this Wednesday. The Federal Reserve has become more aggressive in recent weeks. In this light, the greenback should increase in value rather than the other way around. There is still an upward trend line, and the price is above all the Ichimoku indicator lines.
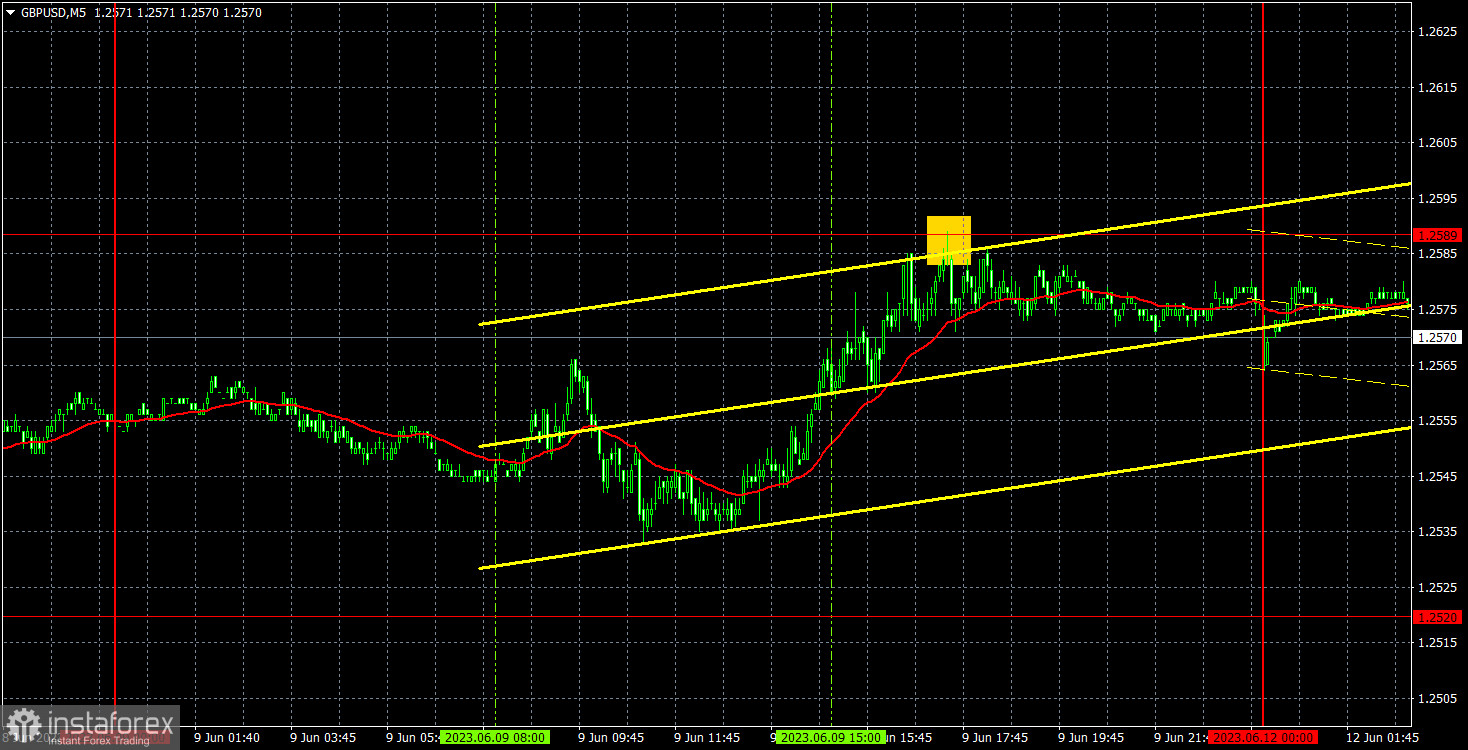
There were practically no trading signals on Friday, and volatility was low. During the American trading session, the pair bounce off 1.2589, but the signal came too late. However, if some traders caught it, they could have gained about 10 pips of profit, but no more.
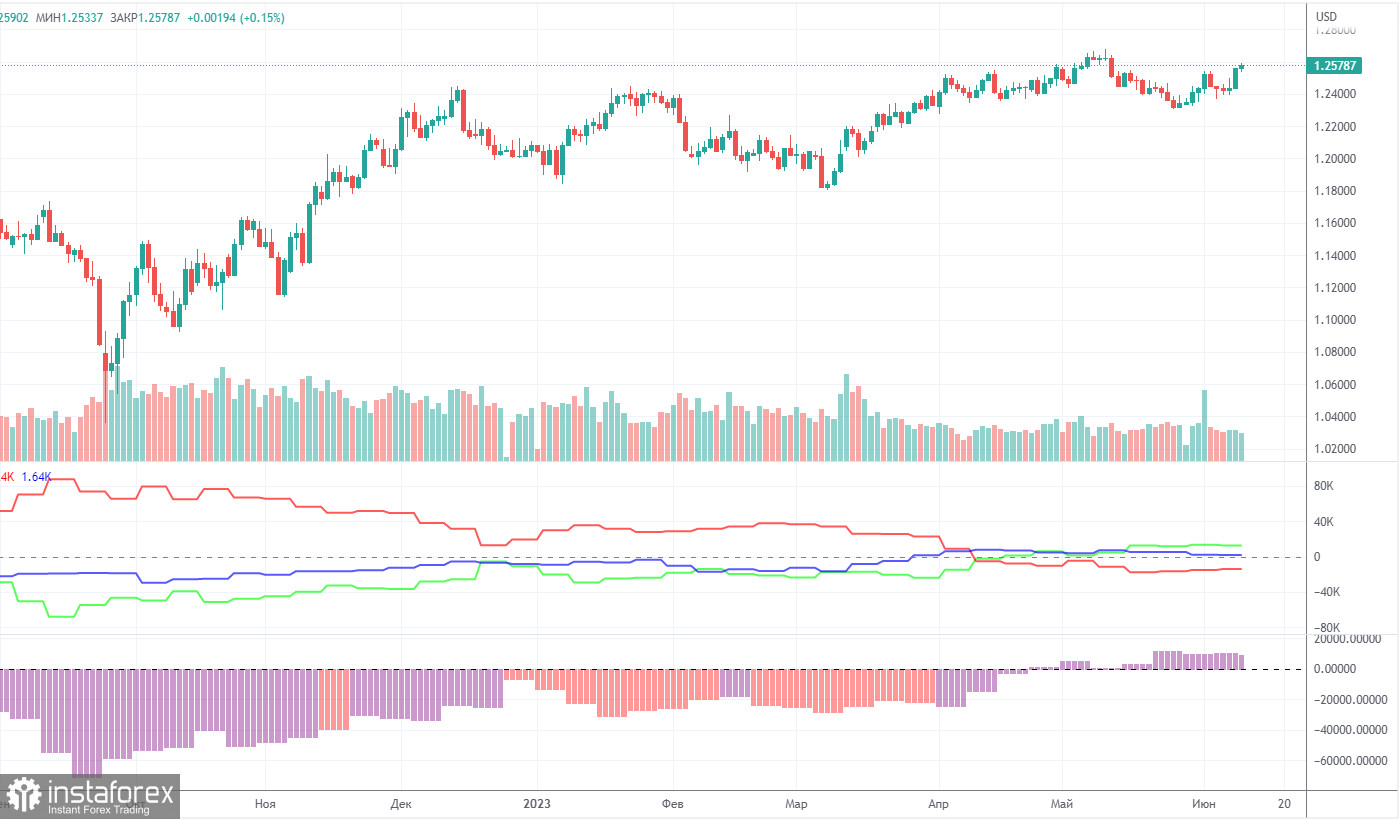
According to the latest report, non-commercial traders closed 5,200 long positions and 4,500 short ones. The net position dropped by 700 but remained bullish. Over the past 9-10 months, the net position has been on the rise despite bearish sentiment. In fact, sentiment is now bullish, but it is a pure formality. The pound is bullish against the greenback in the medium term, but there have been hardly any reasons for that. We assume that a prolonged bear run may soon begin even though COT reports suggest a bullish continuation. However, we can hardly explain why the uptrend should go on.
The pound has gained about 2,300 pips. Therefore, a bearish correction is now needed. Otherwise, a bullish continuation would make no sense even despite the lack of support from fundamental factors. Overall, non-commercial traders hold 52,500 sell positions and 65,000 long ones. We do not see the pair extending growth in the long term.
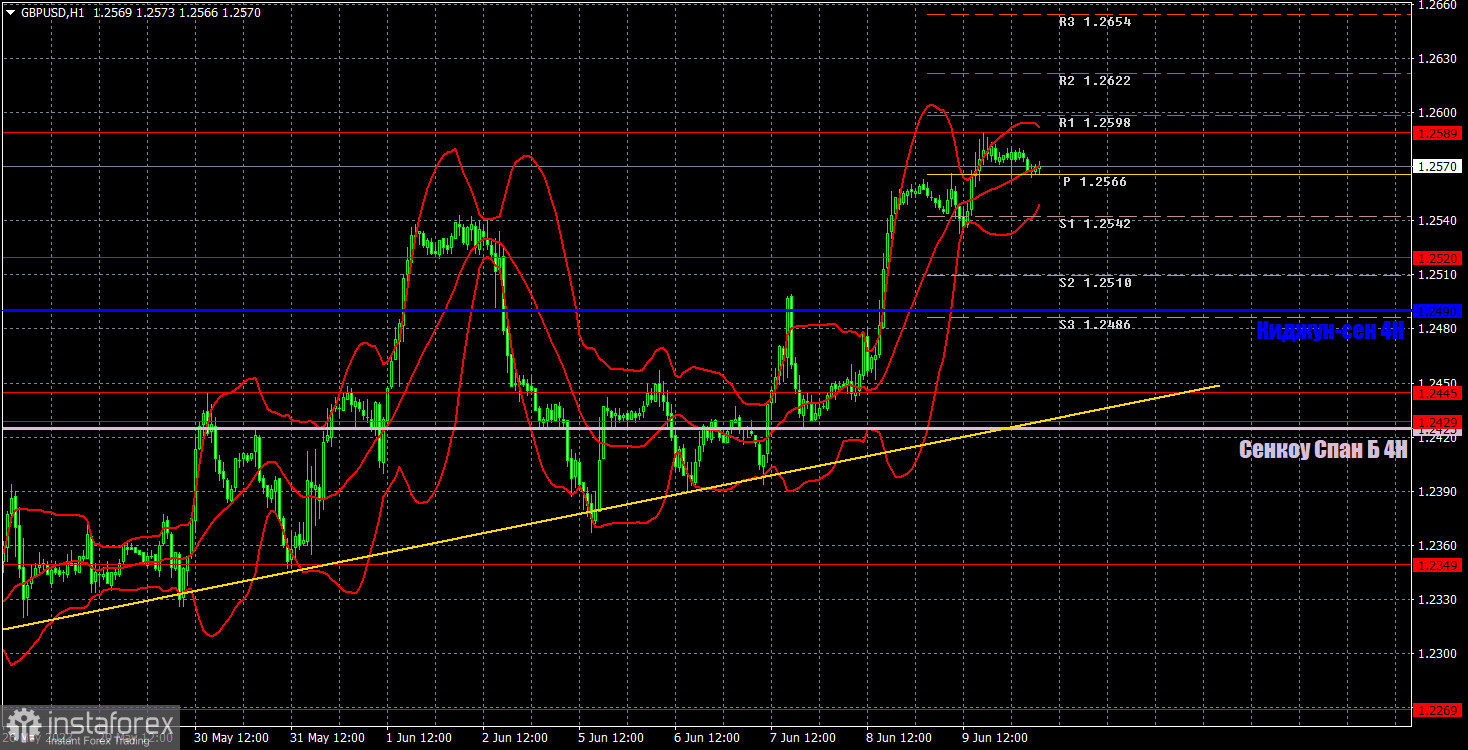
In the H1 time frame, GBP/USD is moving up but abruptly and with pauses. There is currently an ascending trend line, and the price is above the Ichimoku indicator. Technically, a bullish continuation is possible. However, fundamentally and macroeconomically, it makes no sense. Nevertheless, it does not matter for intraday trading whether the price goes up or down. What matters is that it is a strong trend movement. This is exactly what we can expect from the pair this week.
On June 12, trading levels are seen at 1.2269, 1.2349, 1.2429-1.2445, 1.2520, 1.2589, 1.2666, and 1.2762. The Senkou Span B (1.2425) and Kijun-sen (1.2490) may also generate signals when the price either breaks or bounces off them. A Stop Loss should be placed at the breakeven point when the price goes 20 pips in the right direction. Ichimoku indicator lines can move intraday, which should be taken into account when determining trading signals. There are also support and resistance which can be used for locking in profits.
On Monday, no important macro releases are expected to come from the United Kingdom and the United States. We still expect a pullback to the trend line at least. However, volatility is likely to be low today.
Indicators on charts:
Resistance/support - thick red lines, near which the trend may stop. They do not make trading signals.
The Kijun-sen and Senkou Span B lines are the Ichimoku indicator lines moved to the hourly timeframe from the 4-hour timeframe. They are also strong lines.
Extreme levels are thin red lines, from which the price used to bounce earlier. They can produce trading signals.
Yellow lines are trend lines, trend channels, and other technical patterns.
Indicator 1 on the COT chart is the size of the net position of each trader category.
Indicator 2 on the COT chart is the size of the net position for the Non-commercial group of traders.
Díky analytickým přehledům společnosti InstaForex získáte plné povědomi o tržních trendech! Jako zákazníkovi společnosti InstaForex je Vám k dispozici velký počet bezplatných služeb umožňujících efektivní obchodování.

