 Zůstat
Obchodní podmínky
Nástroje


EUR/USD rose on Thursday. At the start of the current upward movement, I thought that it was quite reasonable. Before that, the pair had been declining for a month and an upward correction was necessary. However, the euro is growing every day amid the news that was priced in by investors a couple of months ago. It appears the trajectory of the euro is similar to the pound sterling. The pound sterling is climbing rapidly this week despite the lack of fundamental factors. Yesterday, the ECB raised the key rate by 0.25% which was not a surprise to traders. US economic reports turned out to be weak. So, speculators decided to sell the US currency. Nevertheless, the euro has shown a meteoric rise lately.
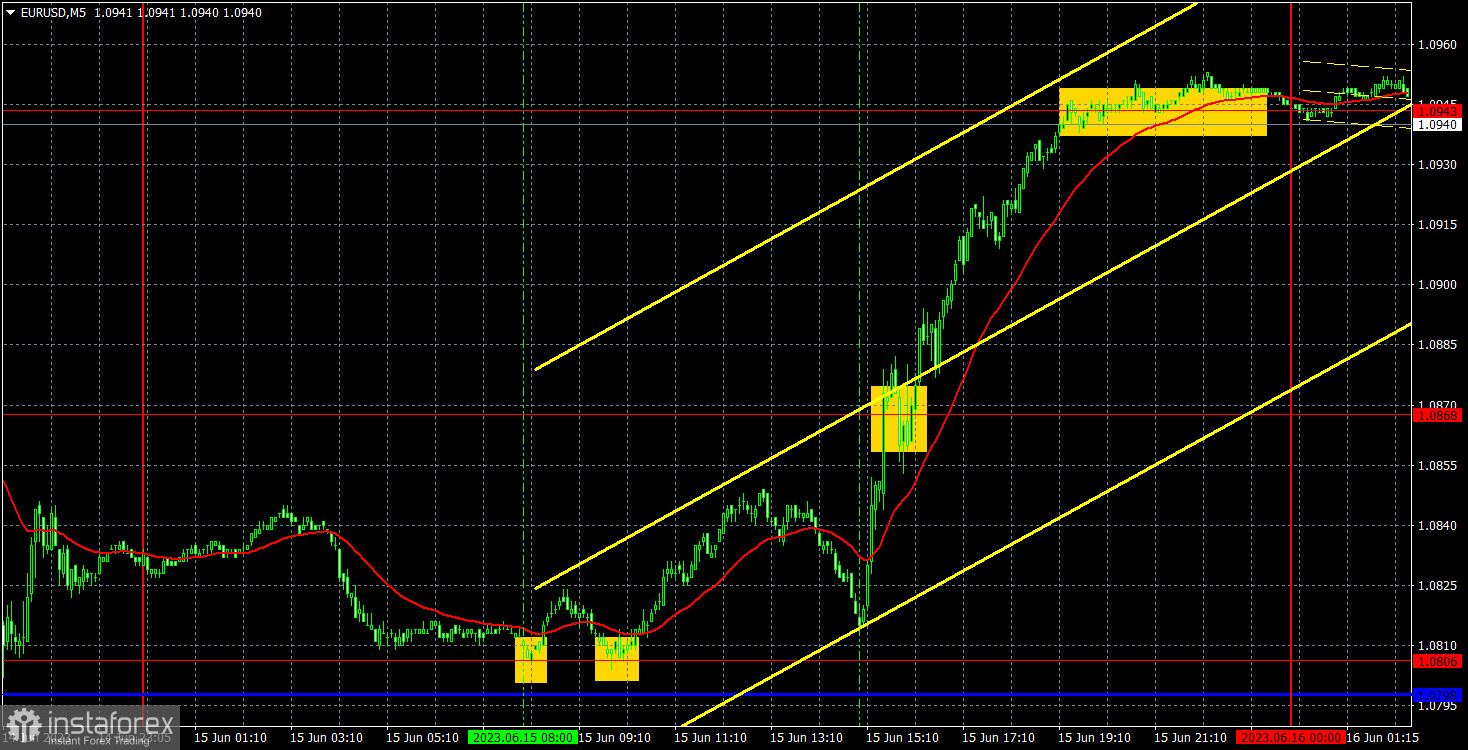
There were several excellent trading signals on Thursday. At the start of the European session, the pair bounced twice from 1.0806, giving buy signals. After that, it had been climbing for the whole day. It approached 1.0943 in the evening. At this level, investors closed long positions. The profit was at least 130 pips.
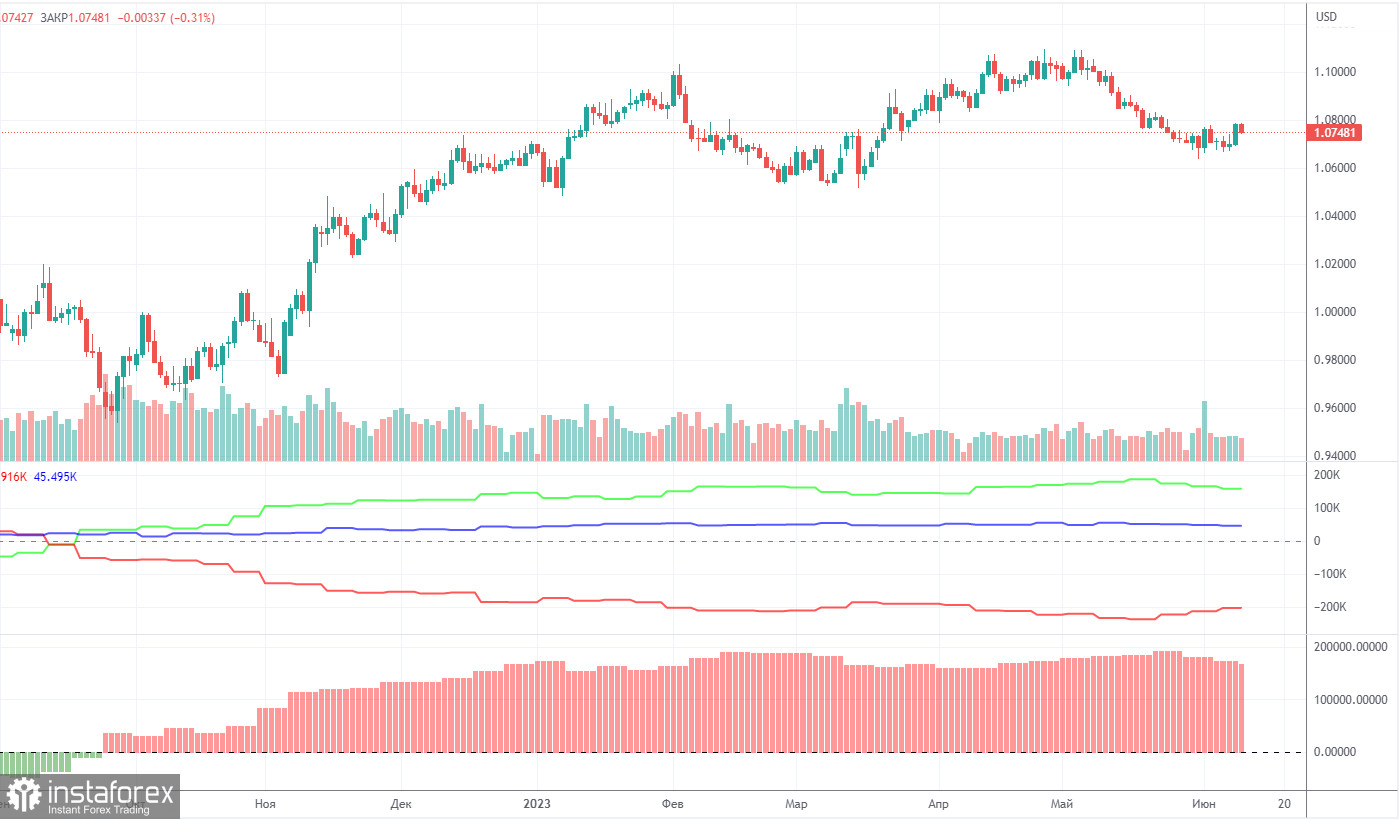
On Friday, a new COT report for June 6 was released. In the last 9 months, COT reports have fully corresponded to what is happening on the market. The chart above clearly shows that the net position of big traders (the second indicator) began to grow again in September 2022. At the same time, the euro resumed an upward movement. The net position of non-commercial traders is bullish. The euro is trading at its highs against the US dollar.
I have already mentioned that a fairly high value of the "net position" indicates the end of the uptrend. The first indicator also signals such a possibility as the red and green lines are very far from each other. It often occurs before the end of the trend. The euro tried to start falling a few months ago but there was only a pullback. During the last reporting week, the number of long positions of the "Non-commercial" group of traders decreased by 5,700 and the number of short positions rose by 1,500. The number of long positions is higher than the number of short ones. This is a very large gap. The number of long positions is 59,000 higher than short ones. The difference is more than three times. The correction has begun. Yet, it may not be a correction but the start of a new downtrend. At this time, it is clear that the pair is likely to resume a downward movement without COT reports.
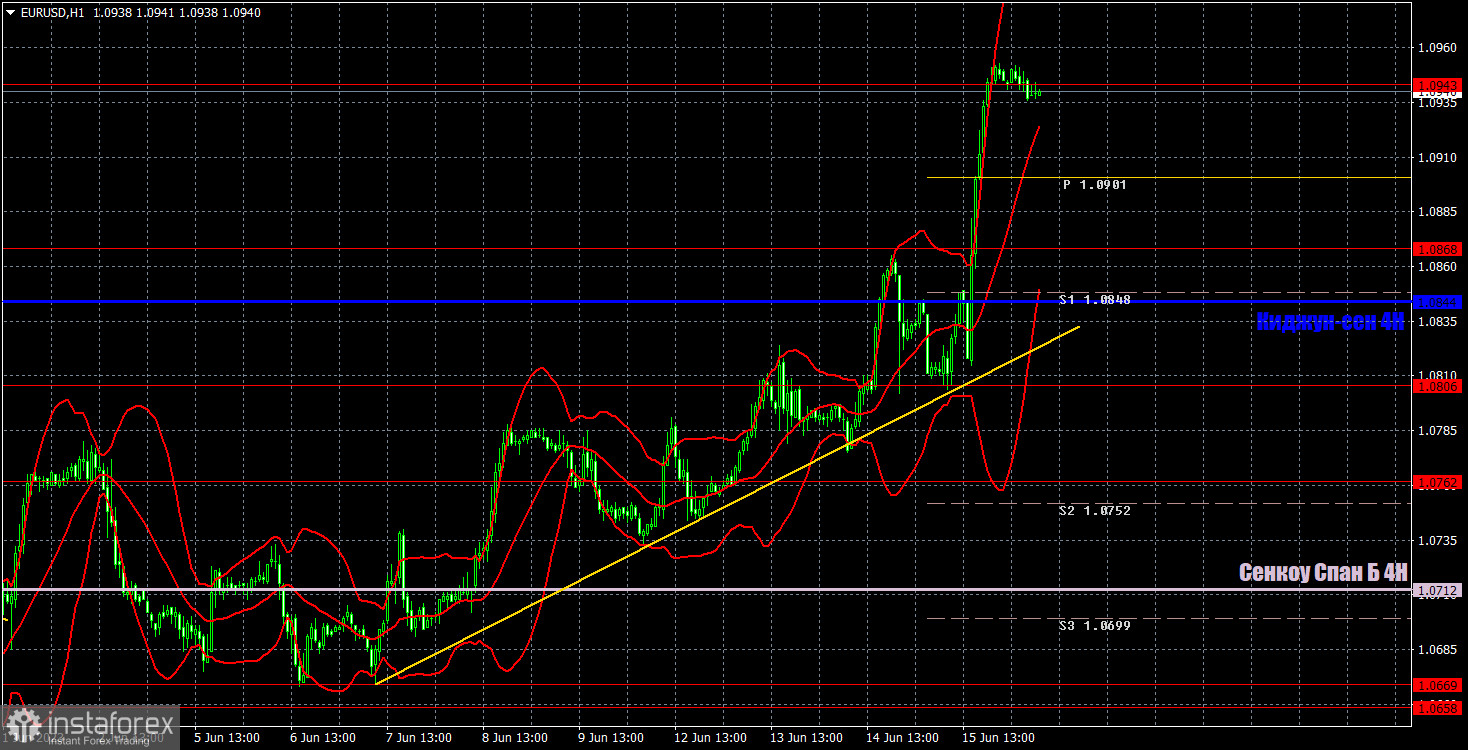
On the 1H, the pair is trying to start an upward correction but there are no drivers for growth. I have already mentioned that this week the trajectory of the pair could be completely unpredictable due to important events. The euro may continue an upward correction. However, after that, it could resume its medium-term decline. So far, the uptrend continues as the pair is located above the lines of the Ichimoku indicator.
On June 14, one should pay attention to the following levels: 1.0581, 1.0658-1.0669, 1.0762, 1.0806, 1.0868, 1.0943, 1.1092, 1.1137, as well as the Senkou Span B (1.0712) and Kijun-sen (1.0844) lines. The lines of the Ichimoku indicator can move during the day. Bear it in mind when determining trading signals. There are also support and resistance levels but they do not provide signals, e.g. bounces or breakouts from extreme levels and lines. Do not forget about placing a Stop Loss order at breakeven if the price moves in the right direction by 15 pips. It will you avoid losses if the signal turns out to be false.
Today, the EU will publish the inflation report for May. The US will unveil the University of Michigan Consumer Sentiment Index. These reports are of the least importance to traders. Thus, the pair may start a downward correction. If the euro grows today, it will indicate the resumption of a steady uptrend.
What's on charts:
Support and resistance levels (resistance /support) are thick red lines near which the trend may end. They do not provide trading signals.
The Kijun-sen and Senkou Span B lines are the lines of the Ichimoku indicator plotted to the H1 chart from the 4H one. They are strong lines.
Extreme levels are thin red lines from which the price bounced earlier. They provide trading signals.
Yellow lines are trend lines, trend channels, and any other technical patterns.
Indicator 1 on the COT charts is the net position size of each category of traders.
Indicator 2 on the COT charts is the net position size for the "Non-commercial" group of traders.
Díky analytickým přehledům společnosti InstaForex získáte plné povědomi o tržních trendech! Jako zákazníkovi společnosti InstaForex je Vám k dispozici velký počet bezplatných služeb umožňujících efektivní obchodování.


