 Zůstat
Obchodní podmínky
Nástroje


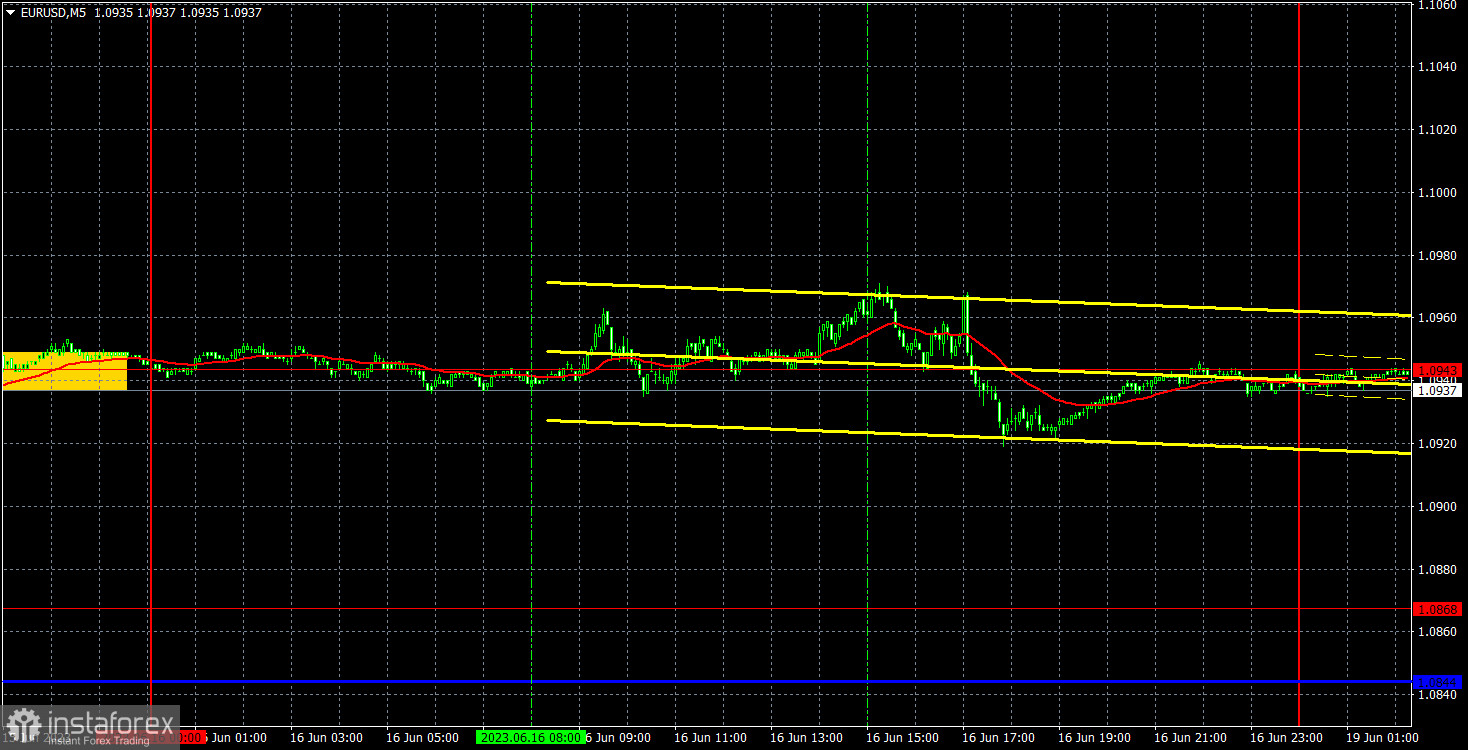
The EUR/USD pair remained unchanged last Friday. The volatility was about 50 pips. This is rather low volatility. Thus, it was extremely difficult to trade even on the smallest timeframes. The economy calendar was empty. This is why trading was so muted. There were only two reports that could cause price movements. The EU unveiled revised inflation data for May, which, of course, did not differ from the first. The University of Michigan Consumer Sentiment Index triggered a modest rise in the US dollar. It turned out to be slightly stronger than forecasts. However, the IS dollar climbed only by 20-30 pips. The pair was stuck in the sideways channel, trading near the level of 1.0943. However, it made no attempts to break through this level.
There were no good entry points last Friday. During the European session, the pair bounced several times from 1.0943. So, traders could open a long position. In the American session, it was obvious that there would be no movements. Therefore, even before the release of the University of Michigan Consumer Sentiment Index speculators closed their long positions with zero profit and exited the market.
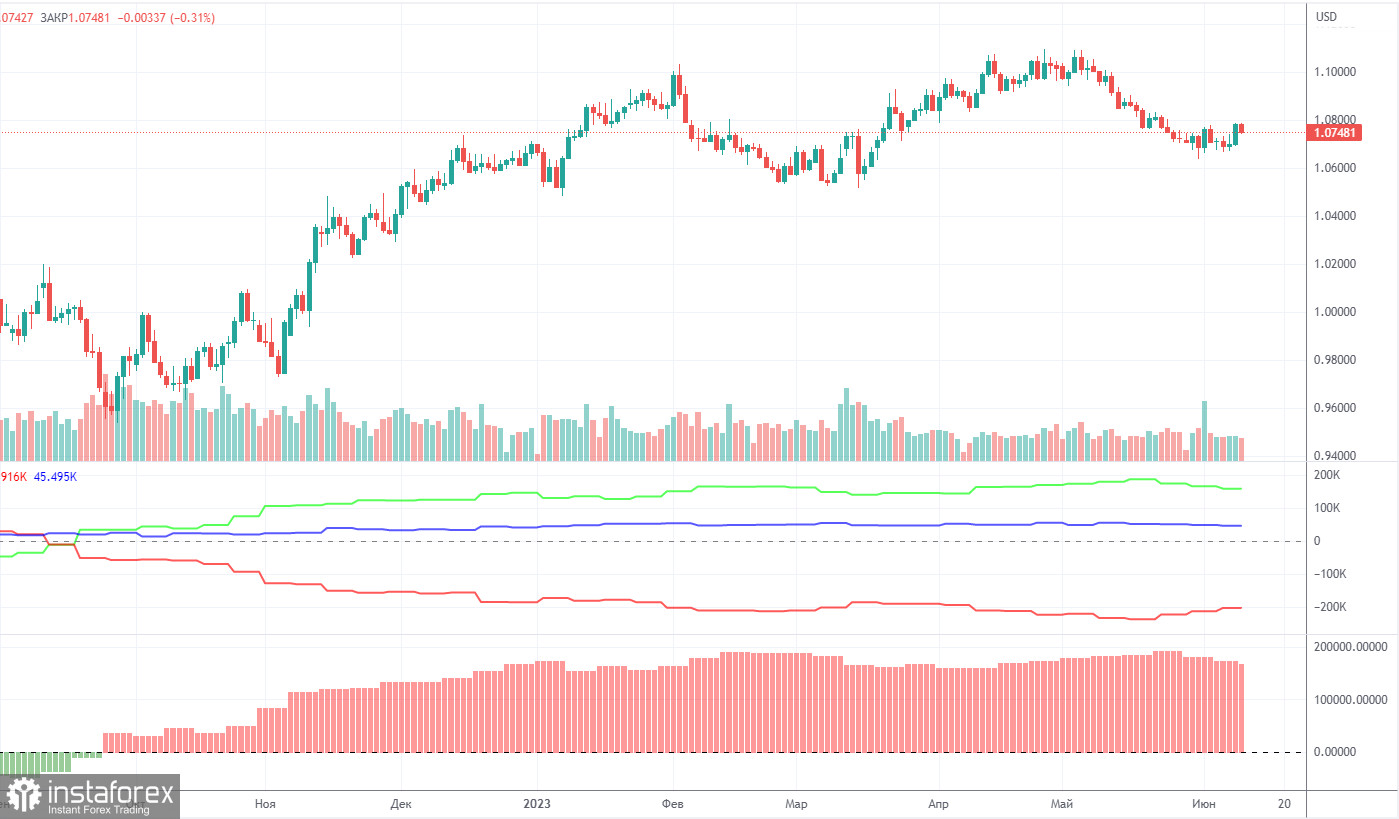
On Friday, a new COT report for June 6 was released. In the last 9 months, COT reports have fully corresponded to what is happening on the market. The chart above clearly shows that the net position of big traders (the second indicator) began to grow again in September 2022. At the same time, the euro resumed an upward movement. The net position of non-commercial traders is bullish. The euro is trading at its highs against the US dollar.
I have already mentioned that a fairly high value of the "net position" indicates the end of the uptrend. The first indicator also signals such a possibility as the red and green lines are very far from each other. It often occurs before the end of the trend. The euro tried to start falling a few months ago but there was only a pullback. During the last reporting week, the number of long positions of the "Non-commercial" group of traders decreased by 5,700 and the number of short positions rose by 1,500. The number of long positions is higher than the number of short ones. This is a very large gap. The number of long positions is 59,000 higher than short ones. The difference is more than three times. The correction has begun. Yet, it may not be a correction but the start of a new downtrend. At this time, it is clear that the pair is likely to resume a downward movement without COT reports.
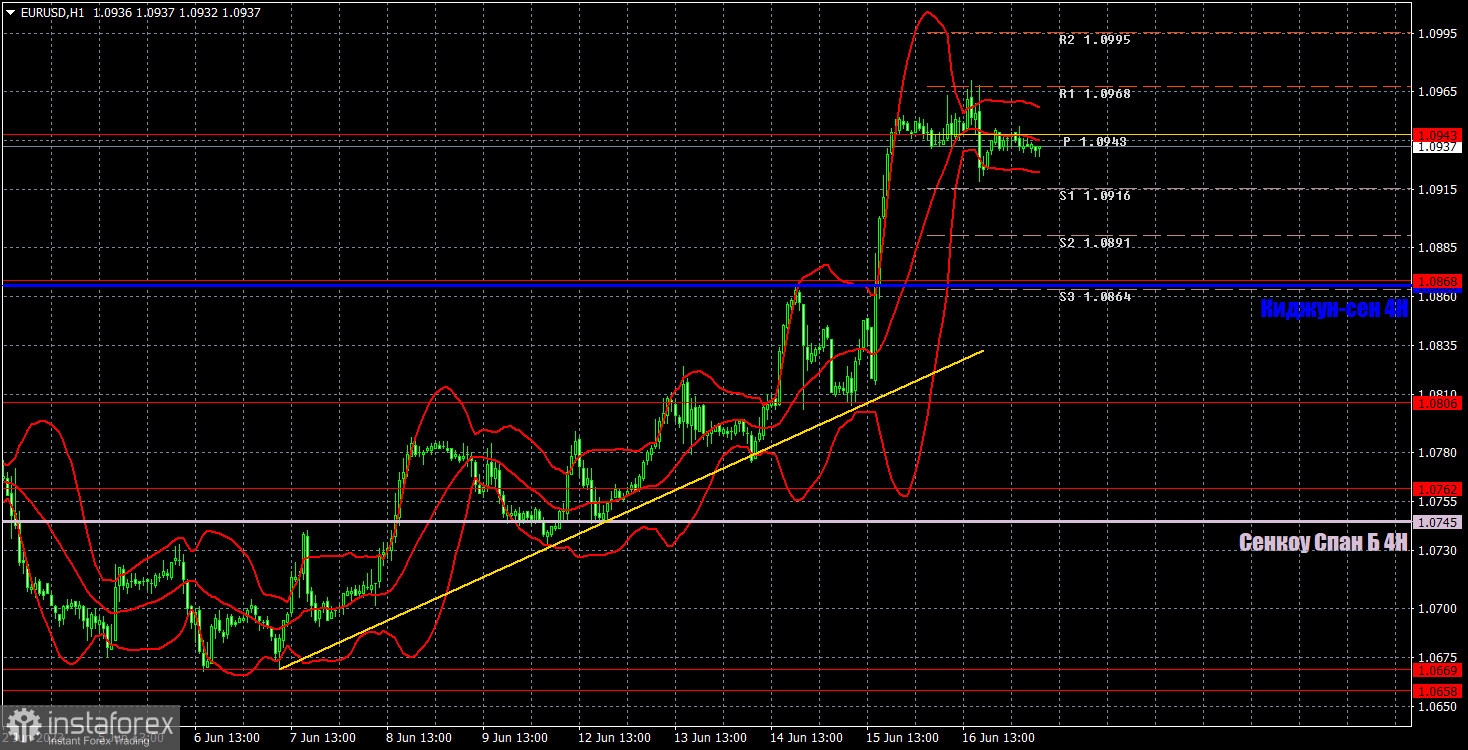
On the 1H, the pair is trying to start an uptrend but there are no drivers for growth. Last week, there were many events that bolstered its rise. However, in the medium term, there are still no reasons to go long. Technical indicators signal an uptrend. It would be better not to sell the pair now. We need to wait at least for consolidation below the trend line and the target level.
On June 19, one should pay attention to the following levels: 1.0581, 1.0658-1.0669, 1.0762, 1.0806, 1.0868, 1.0943, 1.1092, 1.1137, as well as the Senkou Span B (1.0745) and Kijun-sen (1.0863) lines. The lines of the Ichimoku indicator can move during the day. Bear it in mind when determining trading signals. There are also support and resistance levels but they do not provide signals, e.g. bounces or breakouts from extreme levels and lines. Do not forget about placing a Stop Loss order at breakeven if the price moves in the right direction by 15 pips. It will you avoid losses if the signal turns out to be false.
ECB policymakers Luis de Guindos, Philip R. Lane, and Isabelle Schnabel are scheduled to make speeches today. They are likely to voice their commitment to the hawkish stance, which may help the euro advance. High volatility or an upward movement will hardly occur. A corrective pullback looks more likely.
What's on charts:
Support and resistance levels (resistance /support) are thick red lines near which the trend may end. They do not provide trading signals.
The Kijun-sen and Senkou Span B lines are the lines of the Ichimoku indicator plotted to the H1 chart from the 4H one. They are strong lines.
Extreme levels are thin red lines from which the price bounced earlier. They provide trading signals.
Yellow lines are trend lines, trend channels, and any other technical patterns.
Indicator 1 on the COT charts is the net position size of each category of traders.
Indicator 2 on the COT charts is the net position size for the "Non-commercial" group of traders.
Díky analytickým přehledům společnosti InstaForex získáte plné povědomi o tržních trendech! Jako zákazníkovi společnosti InstaForex je Vám k dispozici velký počet bezplatných služeb umožňujících efektivní obchodování.

