 Zůstat
Obchodní podmínky
Nástroje


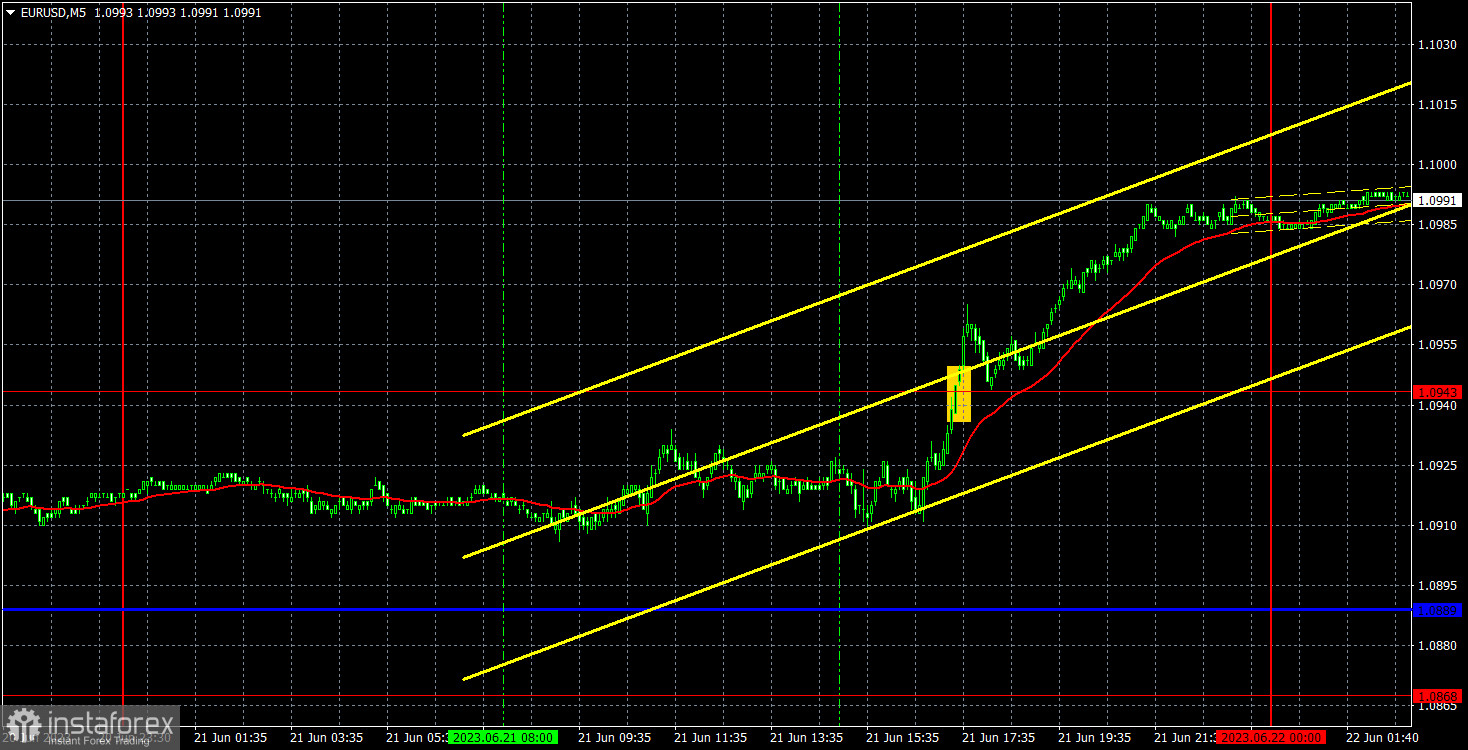
The EUR/USD pair showed a fairly strong upward movement yesterday. In the morning, it remained in a narrow range. There were no important economic reports or events at that time. However, in the afternoon, Jerome Powell testified before the Senate Banking Committee. The euro grew following his speech although his rhetoric was not dovish. He practically did not say anything of importance. Traders are already well aware that the labor market could weaken due to aggressive tightening and unemployment could rise. The Fed also hinted it could raise the interest rate 1-2 more times this year. All this information should have triggered an increase in the US dollar, not its fall.
There was only one entry point formed yesterday. In the American session, the pair jumped to 1.0943. After that, it managed to go up another 30 pips. I would advise you to close long positions manually as no more signals were generated until the end of the day. As a result, the euro continues to grow. Investors are puzzled why it is rising. The ECB keeps giving mixed signals about a rate hike after the summer of 2023.
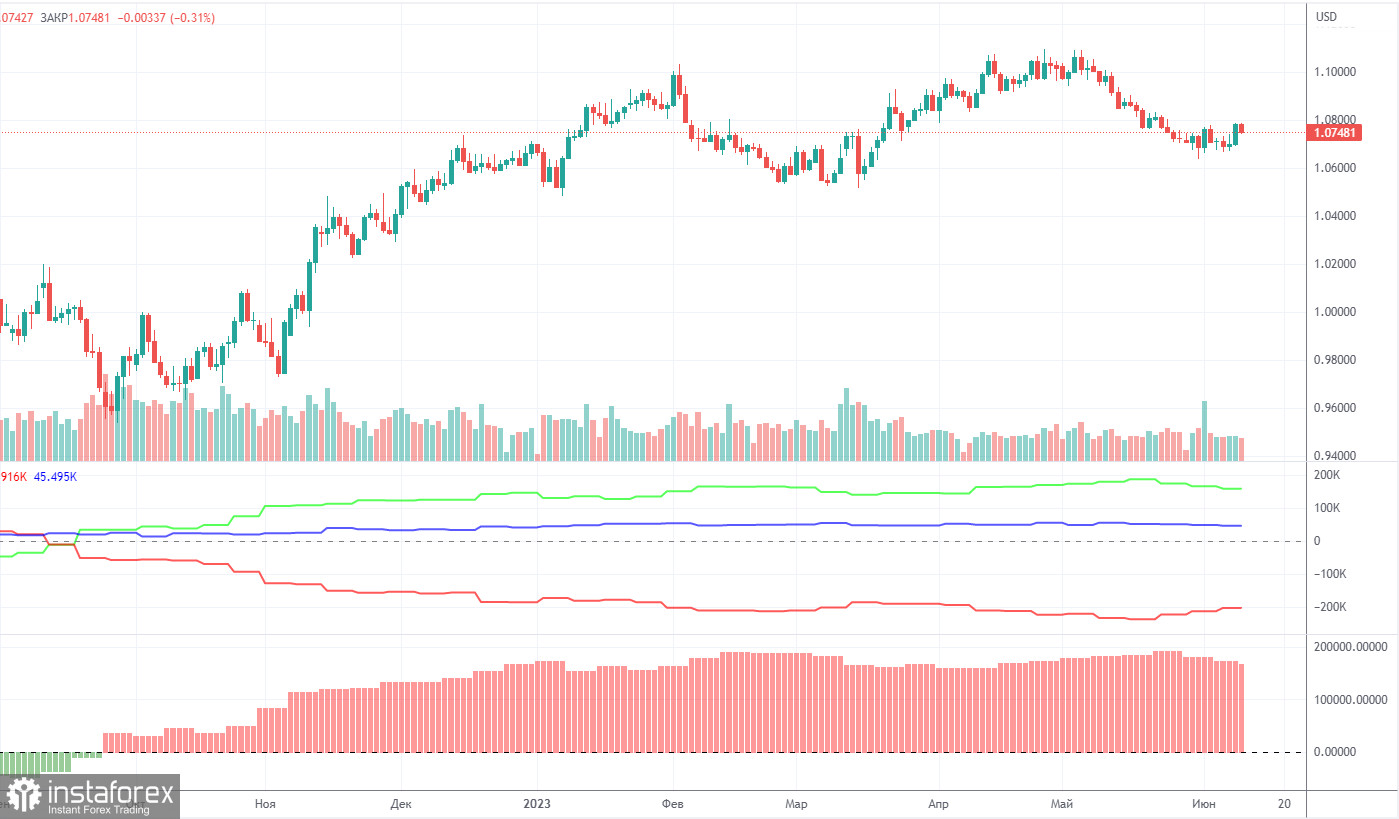
The latest COT report was released on June 6. In the last 9 months, COT reports have fully corresponded to what is happening on the market. The chart above clearly shows that the net position of big traders (the second indicator) began to grow again in September 2022. At the same time, the euro resumed an upward movement. The net position of non-commercial traders is bullish. The euro is trading at its highs against the US dollar.
I have already mentioned that a fairly high value of the "net position" indicates the end of the uptrend. The first indicator also signals such a possibility as the red and green lines are very far from each other. It often occurs before the end of the trend. The euro tried to start falling a few months ago but there was only a pullback. During the last reporting week, the number of long positions of the "Non-commercial" group of traders decreased by 5,700 and the number of short positions rose by 1,500. The number of long positions is higher than the number of short ones. This is a very large gap. The number of long positions is 59,000 higher than short ones. The difference is more than three times. The correction has begun. Yet, it may not be a correction but the start of a new downtrend. At this time, it is clear that the pair is likely to resume a downward movement without COT reports.
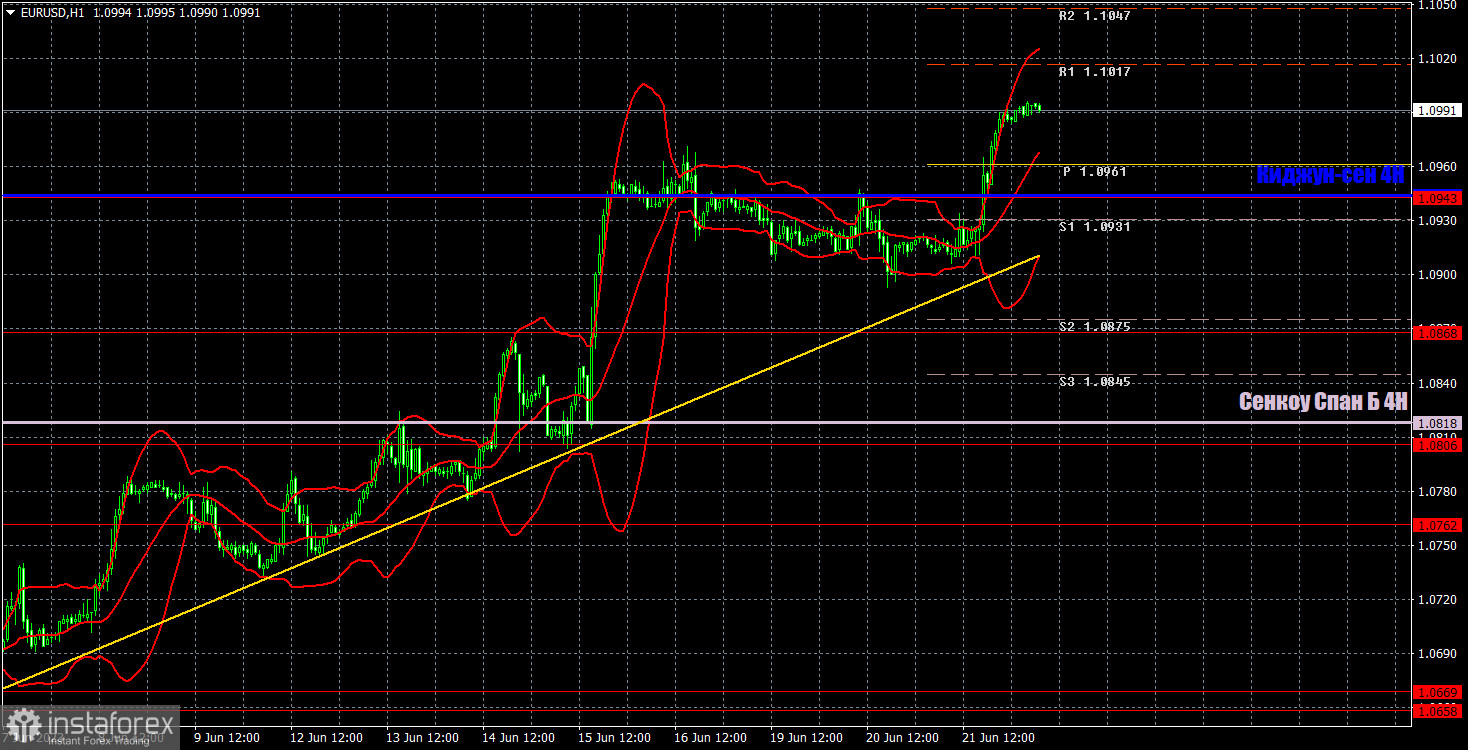
On the 1H, the pair maintains an uptrend but there are no drivers for growth. Last week, there were many events that bolstered its rise. However, in the medium term, there are still no reasons to go long. Technical indicators signal an uptrend. It would be better not to sell the pair now. We need to wait at least for consolidation below the trend line and the target level.
On June 22, one should pay attention to the following levels: 1.0658-1.0669, 1.0762, 1.0806, 1.0868, 1.0943, 1.1092, 1.1137 as well as the Senkou Span B (1.0818) and Kijun-sen (1.0944) lines. The lines of the Ichimoku indicator can move during the day. Bear it in mind when determining trading signals. There are also support and resistance levels but they do not provide signals, e.g. bounces or breakouts from extreme levels and lines. Do not forget about placing a Stop Loss order at breakeven if the price moves in the right direction by 15 pips. It will you avoid losses if the signal turns out to be false.
ECB Vice-President Luis de Guindos will make a speech speak today. Jerome Powell, Michelle Bowman, Loretta Meister, and Thomas Barkin will also make comments. The Us will unveil initial jobless claims data. It may impact market sentiment if the reading does not coincide with forecasts.
What's on charts:
Support and resistance levels (resistance /support) are thick red lines near which the trend may end. They do not provide trading signals.
The Kijun-sen and Senkou Span B lines are the lines of the Ichimoku indicator plotted to the H1 chart from the 4H one. They are strong lines.
Extreme levels are thin red lines from which the price bounced earlier. They provide trading signals.
Yellow lines are trend lines, trend channels, and any other technical patterns.
Indicator 1 on the COT charts is the net position size of each category of traders.
Indicator 2 on the COT charts is the net position size for the "Non-commercial" group of traders.
Díky analytickým přehledům společnosti InstaForex získáte plné povědomi o tržních trendech! Jako zákazníkovi společnosti InstaForex je Vám k dispozici velký počet bezplatných služeb umožňujících efektivní obchodování.

