 Zůstat
Obchodní podmínky
Nástroje


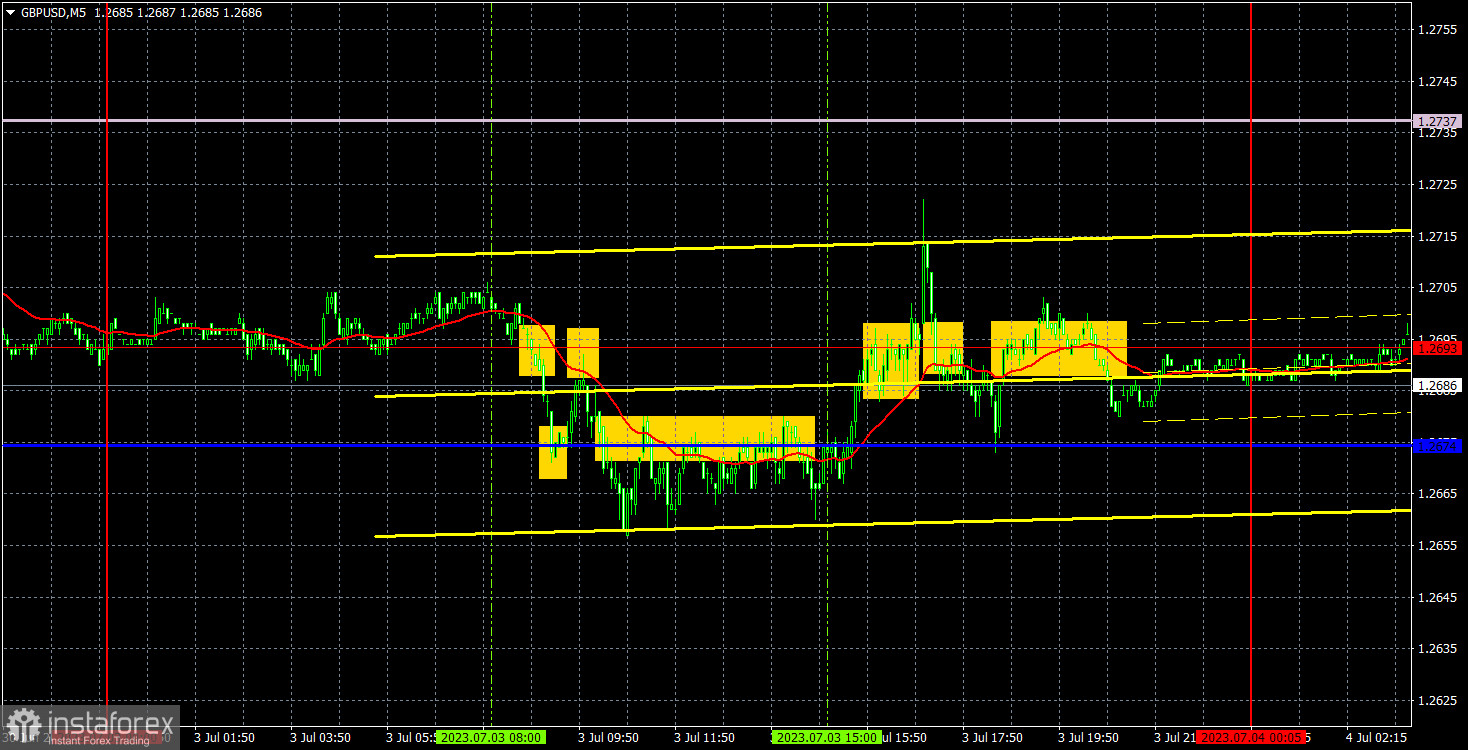
The GBP/USD pair only demonstrated one thing on Monday - flat and chaos. The chart clearly shows how the pair moved throughout the day. Constant reversals, low volatility, sideways direction, sudden bursts of trader activity. In general, it was extremely difficult and inconvenient to trade. On the hourly chart, the pair is stuck between two trend lines, and also between the Senkou Span B and Kijun-sen lines. Yesterday's macro data initially supported the dollar, then the pound. The UK and US manufacturing PMIs turned out worse than estimated. The pound is demonstrating complex and unappealing movements at the beginning of the new trading week. We will likely witness the same thing today since the US is celebrating a holiday.
Speaking of trading signals, they were unusually weak and false. It was not worth trading between the Kijun-sen line and the 1.2693 level, as the distance between them was 19 points... Consolidating below the critical line promised nothing good, as the Stop Loss would have to be set above 1.2693, and since volatility is low, we don't expect strong downward movement. The same applies to the signal of consolidating above the 1.2693 level during the US session. The best decision was not to enter the market, because the pair was in a limited area and by the time the ISM index was published (which could really provoke a good movement) it only showed unclear movements and a flat.

According to the latest report, non-commercial traders opened 2,800 long positions and closed 2,500 short ones. The net position increased by 5,300 in just a week and continues to grow. Over the past 9-10 months, the net position has been on the rise. We are approaching a point where the net position has grown too much to expect further growth. We assume that a prolonged bear run may soon begin, even though COT reports suggest a bullish continuation. It is becoming increasingly difficult to believe in it with each passing day. We can hardly explain why the uptrend should go on. However, there are currently no technical sell signals.
The pound has gained about 2,500 pips. Therefore, a bearish correction is now needed. Otherwise, a bullish continuation would make no sense. Overall, non-commercial traders hold 52,300 sell positions and 104,400 long ones. Such a gap suggests the end of the uptrend. We do not see the pair extending growth in the long term.
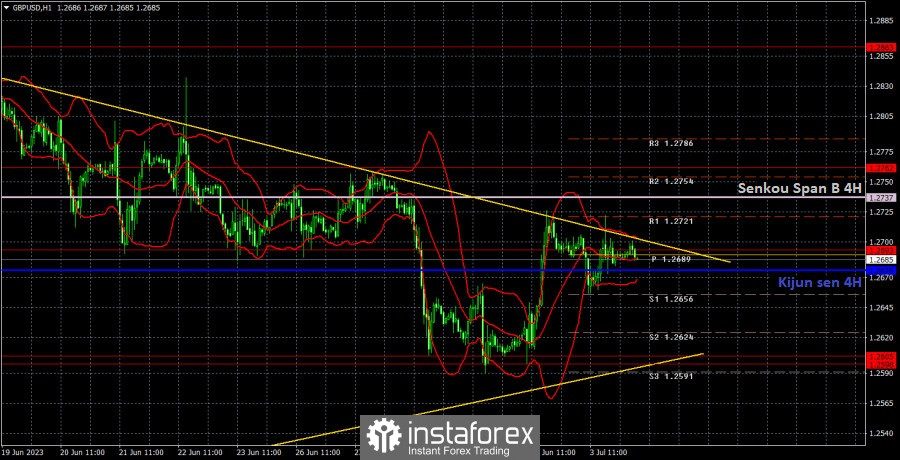
In the 1-hour chart, GBP/USD maintains a bullish bias, although it is correcting at the moment. The ascending trend line serves as a buy signal. However, we still believe that the British currency is overvalued and should fall in the medium term. A downward trend line has also formed, which looks stronger than the ascending one, but at the same time there are two of the most important Ichimoku indicator lines nearby. The pound is edging down, but the movement looks unconvincing.
On July 4, trading levels are seen at 1.2349, 1.2429-1.2445, 1.2520, 1.2598-1.2605, 1.2693, 1.2762, 1.2863, 1.2981-1.2987. The Senkou Span B (1.2737) and Kijun-sen (1.2676) may also generate signals when the price either breaks or bounces off them. A Stop Loss should be placed at the breakeven point when the price goes 20 pips in the right direction. Ichimoku indicator lines can move intraday, which should be taken into account when determining trading signals. There are also support and resistance which can be used for locking in profits.
No important events lined up in the UK and the US. July 4th is Independence Day in the United States, so all banks, platforms, and exchanges are closed today. The pair will likely go through low volatility, so we shouldn't expect any trends.
Resistance/support - thick red lines, near which the trend may stop. They do not make trading signals.
The Kijun-sen and Senkou Span B lines are the Ichimoku indicator lines moved to the hourly timeframe from the 4-hour timeframe. They are also strong lines.
Extreme levels are thin red lines, from which the price used to bounce earlier. They can produce trading signals.
Yellow lines are trend lines, trend channels, and other technical patterns.
Indicator 1 on the COT chart is the size of the net position of each trader category.
Indicator 2 on the COT chart is the size of the net position for the Non-commercial group of traders.
Díky analytickým přehledům společnosti InstaForex získáte plné povědomi o tržních trendech! Jako zákazníkovi společnosti InstaForex je Vám k dispozici velký počet bezplatných služeb umožňujících efektivní obchodování.

