 Zůstat
Obchodní podmínky
Nástroje


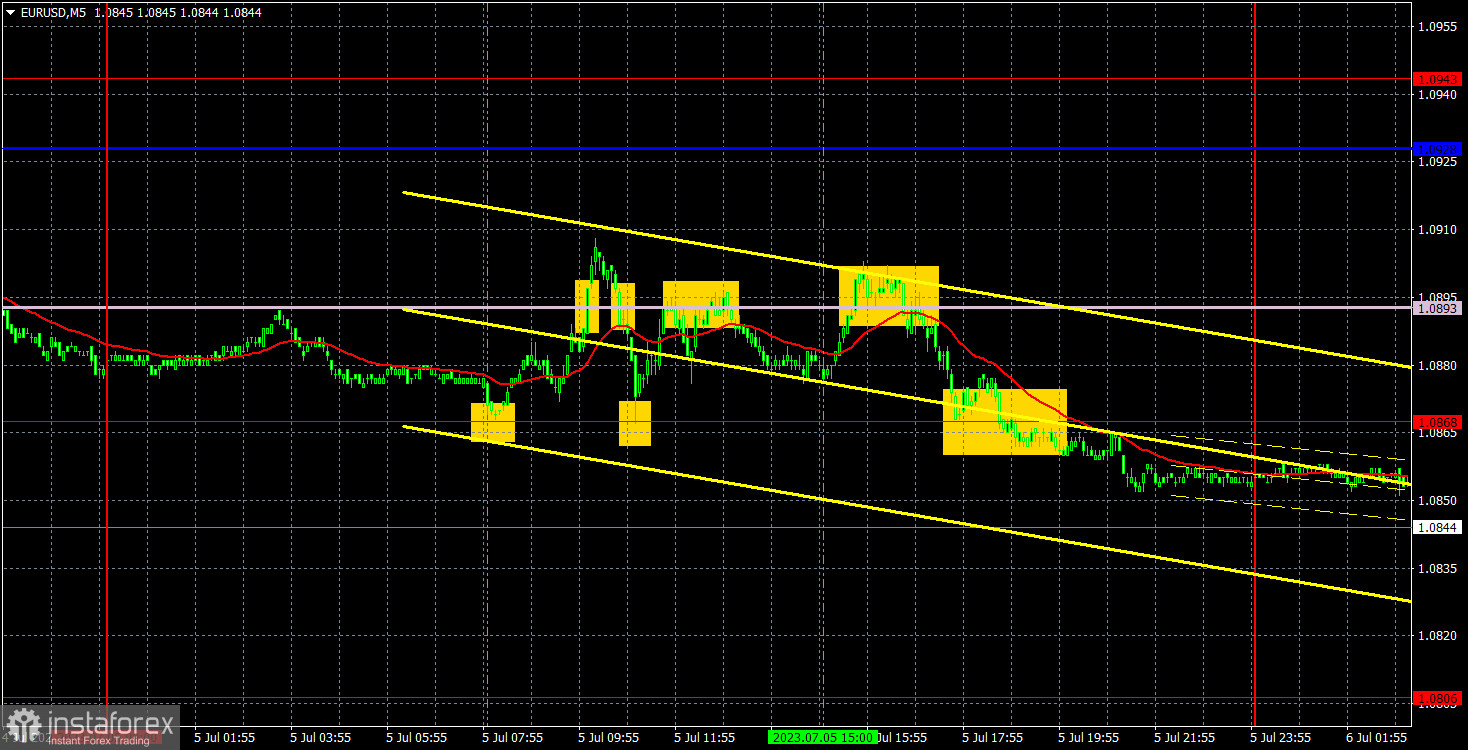
The EUR/USD pair was in a flat phase on Wednesday. The pair stayed between the Senkou Span B line and the 1.0868 level for most of the day, with just a distance of 25 points between them. Volatility was 56 points. It was the third consecutive low-volatility day. Among yesterday's macroeconomic events, we could highlight the second estimates of services PMIs of Germany and the EU, which did not differ from the previous estimates, and in the evening, the minutes of the last Federal Reserve meeting were published, which also did not stir a clear market response.
There were several trading signals, as the pair moved in an area where there were lines and levels. In general, all the signals were rebounds from Senkou Span B and the 1.0868 level. Was it worth trading between two levels, the distance between which was 25 points? For purely hypothetical reasons, what profit could we expect from such trades? 5-10 points? If traders were interested in such a level of profit, then almost every signal could have been executed, and traders could gain about 30-40 points of profit. We consider them as good signals since the pair reached the nearest target level in almost every case.
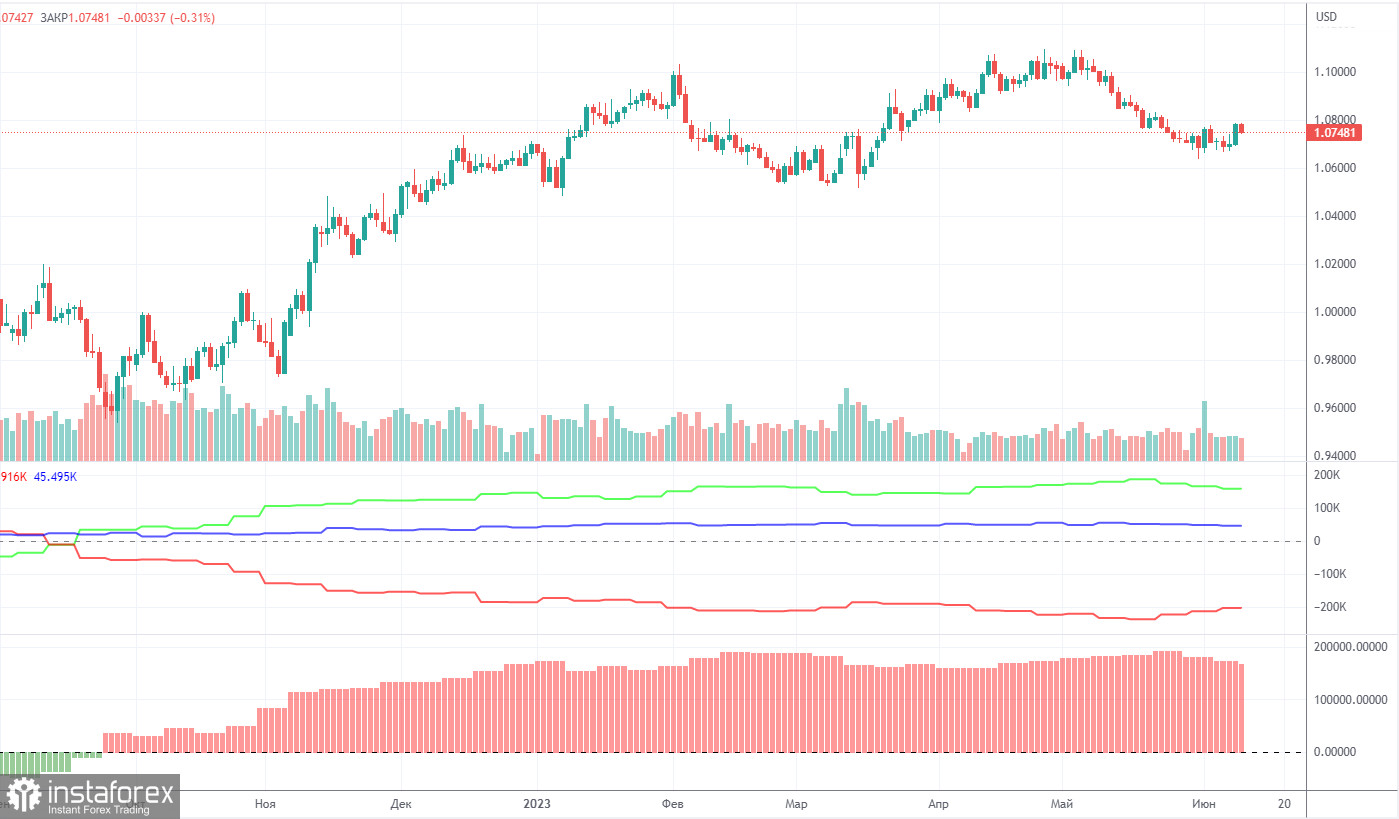
On Friday, the new COT report for June 27 was released. Over the past 10 months, COT data has been in line with developments in the market. The net position of large traders (the second indicator on the chart) has been on the rise since September 2022. The euro started to show strength approximately at the same time. Currently, the net non-commercial position is bullish and keeps growing further. Meanwhile, the euro is still strong against the dollar. We have repeatedly pointed out that a relatively high value of the net position suggests a potential end of the uptrend. This is shown by the first indicator, where the red and green lines have significantly diverged, which often precedes a trend reversal. The euro attempted to decline in early May, but it resulted in a minor and not very strong retracement.
During the last reporting week, the number of long positions held by non-commercial traders decreased by 5,400 while the number of short positions fell by 5,800. As a result, the net position dropped by 400. The number of long positions still exceeds the number of short ones by 145,000, an almost threefold gap. A new correction phase has begun, which may indicate the start of a new downtrend. So, it is clear that the pair will be bearish even without COT reports.
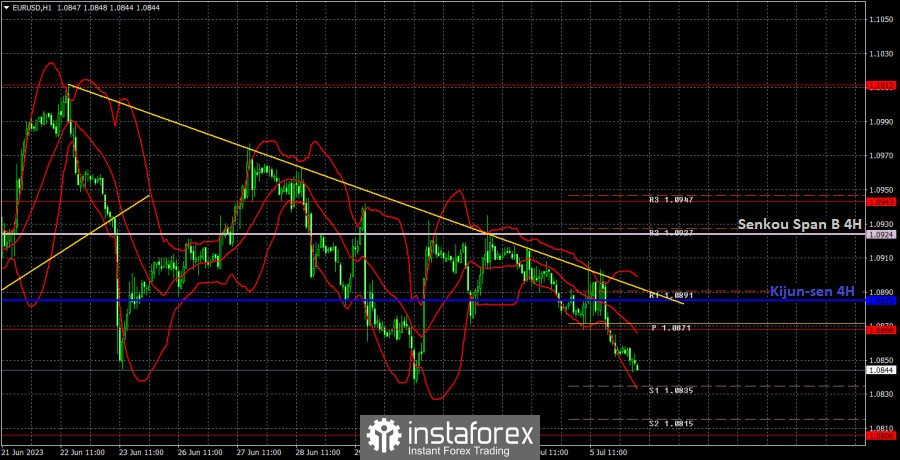
In the 1-hour chart, the pair continues its decline, forming a new descending trendline. Currently, the pair is near the lines of the Ichimoku indicator. We can expect a reversal to the downside and a resumption of the downtrend as more significant events are scheduled for the second half of the week. We believe that the euro should fall.
On July 6, trading levels are seen at 1.0658-1.0669, 1.0762, 1.0806, 1.0868, 1.0943, 1.1012, 1.1092, as well as Senkou Span B (1.0924) and Kijun-sen (1.0885). Ichimoku indicator lines can move intraday, which should be taken into account when determining trading signals. There are also support and resistance although no signals are made near these levels. Signals could be made when the price either breaks or bounces from these extreme levels. Do not forget to place Stop Loss at the breakeven point when the price goes by 15 pips in the right direction. In case of a false breakout, it could save you from possible losses.
Today, the EU will release a retail sales report, and the US will publish important reports on unemployment benefit claims, changes in the number of open JOLTs vacancies, the ADP report, and the ISM business activity index for the services sector. All four US reports can be considered quite important, so the volatility may gradually increase during the US session.
Resistance/support - thick red lines, near which the trend may stop. They do not make trading signals.
Kijun-sen and Senkou Span B are the Ichimoku indicator lines moved to the hourly timeframe from the 4-hour timeframe. They are also strong lines.
Extreme levels are thin red lines, from which the price used to bounce earlier. They can produce trading signals.
Yellow lines are trend lines, trend channels, and other technical patterns.
Indicator 1 on the COT chart is the size of the net position of each trader category.
Indicator 2 on the COT chart is the size of the net position for the Non-commercial group of traders.
Díky analytickým přehledům společnosti InstaForex získáte plné povědomi o tržních trendech! Jako zákazníkovi společnosti InstaForex je Vám k dispozici velký počet bezplatných služeb umožňujících efektivní obchodování.

