 Zůstat
Obchodní podmínky
Nástroje


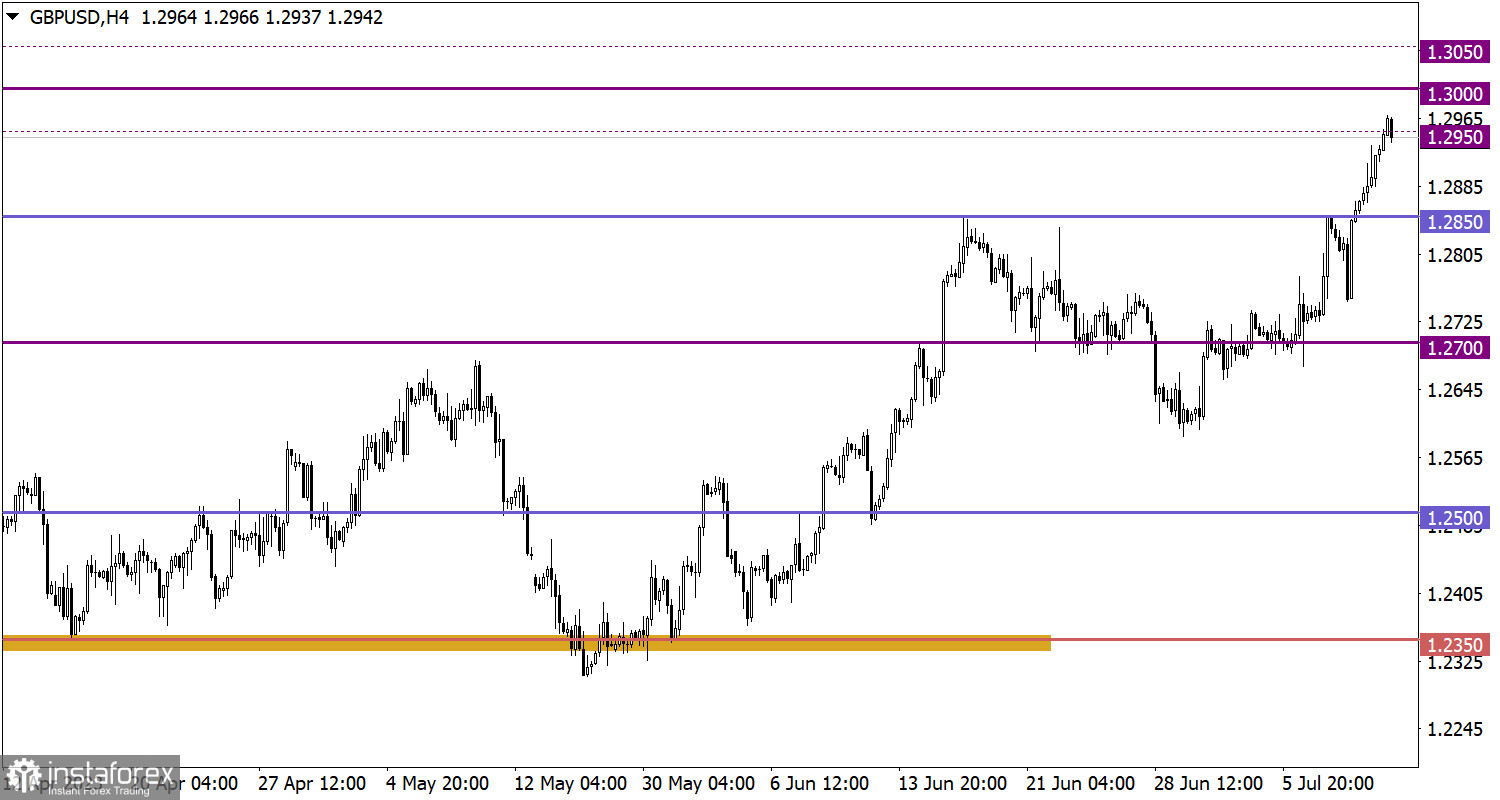
The UK labor market data turned out to be worse than expected. Unemployment and job growth were not in line with forecasts. The unemployment rate rose to 4%, while it was expected to remain at the same level. As for employment growth in May, the UK economy added 102K, which was also below the expected level. Wage statistics are also challenging for the Bank of England. Salaries grew to 7.4% in May from a year ago. The average growth over the past 3 months was 6.9% on year. Particularly significant growth in wages is recorded in the private sector, where the regular component of wages increased by 7.1% in annual terms. Such an increase in wages creates inflationary risks. So, the Bank of England, given its lag, is forced to continue raising interest rates. The market is betting on a 50-basis point rate hike at the next meeting.
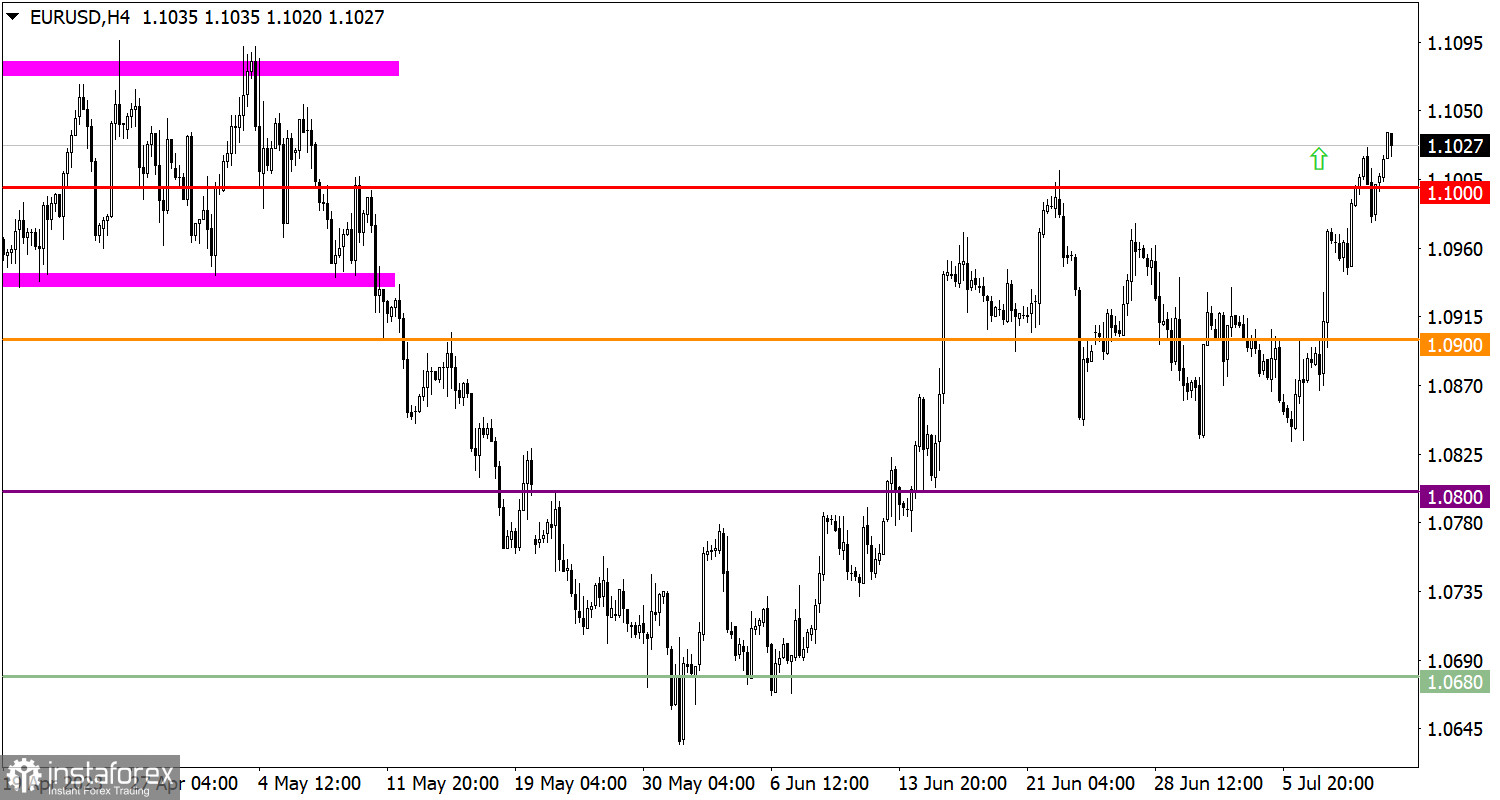
EUR/USD has settled above 1.1000 which proves that traders are bullish about the euro.
At the same time, the pound sterling reached the psychological level of 1.2950/1.3000 against the US dollar as a result of the inertial move.

The highlight today and in the whole week is the inflation data in the United States. The annual rate of the consumer price index is expected to slip from 4.0% to 3.1% in June. This slowdown arouses serious doubts about further interest rate hikes by the Federal Reserve. It might happen that the planned "pause" could turn into a full stop before a reversal. This, in turn, may set the stage for further weakening of the US dollar.
EUR/USD is currently overbought on the daily chart. Nevertheless, speculators could neglect technical signals during the ongoing inertial move. In this case, the instrument could carry on with its move toward the local high printed in April this year. However, the bearish scenario is also possible. In this case, EUR/USD could enter a retracement stage, pulling back to 1.1000. The downward retracement will stall the current bullish cycle.
According to technical analysis, the psychological level of 1.3000 serves as resistance for GBP/USD. The price has already reached the lower resistance level. This could assure traders to cut on long positions. In turn, the price will pull back downward. However, if the instrument settles above 1.3050, it could reinforce the medium-term uptrend. Thus, the medium-term outlook is bullish.
The candlestick chart type is white and black graphic rectangles with lines above and below. With a detailed analysis of each individual candle, you can see its characteristics relative to a particular time frame: opening price, closing price, intraday high and low.
Horizontal levels are price coordinates, relative to which a price may stop or reverse its trajectory. In the market, these levels are called support and resistance.
Circles and rectangles are highlighted examples where the price reversed in history. This color highlighting indicates horizontal lines that may put pressure on the asset's price in the future.
The up/down arrows are landmarks of the possible price direction in the future.
Díky analytickým přehledům společnosti InstaForex získáte plné povědomi o tržních trendech! Jako zákazníkovi společnosti InstaForex je Vám k dispozici velký počet bezplatných služeb umožňujících efektivní obchodování.


