 Zůstat
Obchodní podmínky
Nástroje


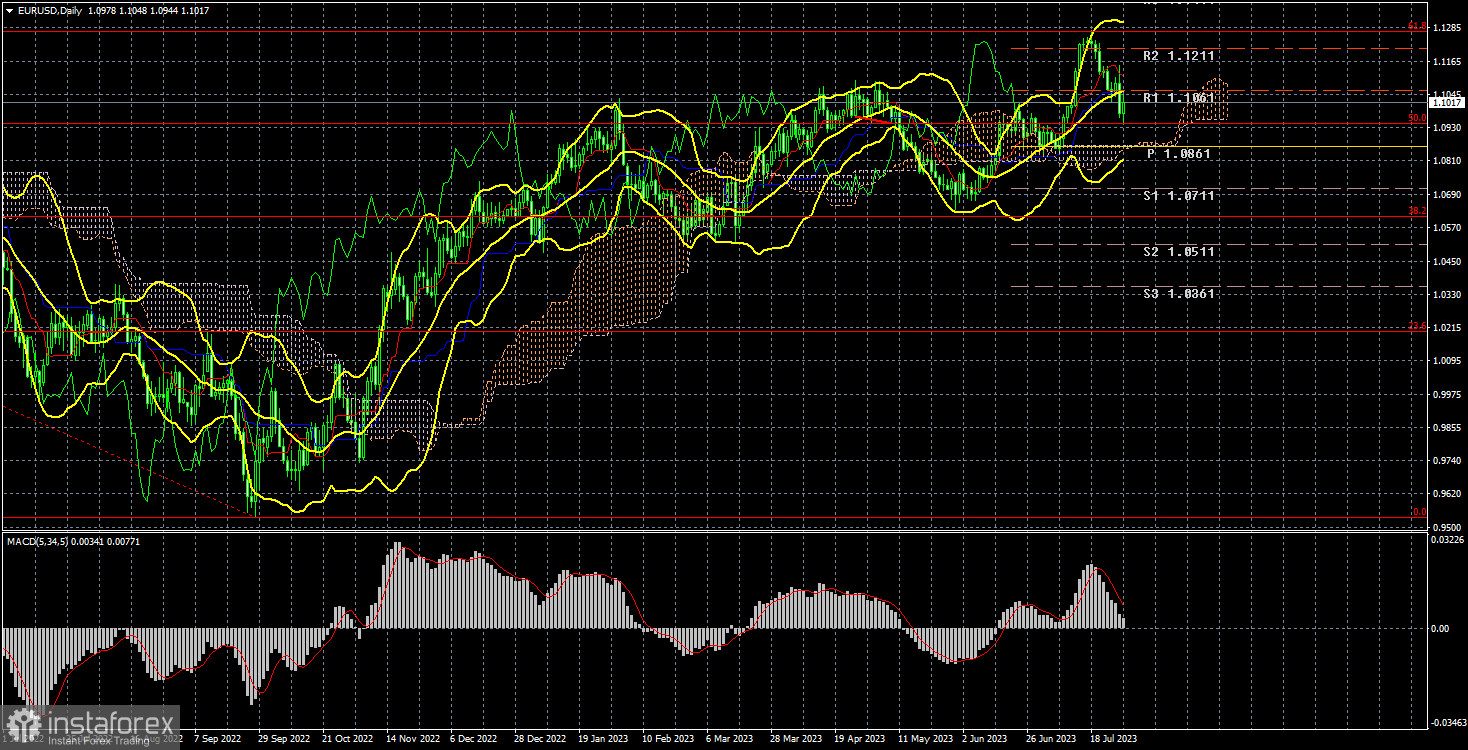
The EUR/USD currency pair experienced a 110-point decline in the past week. However, this drop cannot be considered significant, as the euro has declined for only two weeks, losing 230 points. 230 points in a 24-hour timeframe might not indicate a strong downward movement. The price has settled below the critical line, but this should not mislead traders, as the upward movement in 2023 has not been notably strong. The proximity of the Kijun-sen line to the price suggests that settling below it does not serve as a strong signal for a correction or a trend change.
Over the past year, there have been enough corrections of 200–300 points, each leading to a resumption of the upward trend. However, this upward trend has been rather conditional in the last six months. Although the pair has gained 300 points since the beginning of the year, the lack of strong growth or significant corrections indicates that the pair is more stagnant in the long term than showing substantial growth.
The euro's recent growth is difficult to explain fundamentally or macroeconomically, as the fundamental background no longer supports the euro more than the dollar. This week, Christine Lagarde hinted at a possible pause in monetary policy tightening in September, which could signify the end of the tightening cycle. The euro's high trading levels in the last six months, driven by market expectations regarding the ECB rate, will likely change with this new information. Comparatively, the Federal Reserve had already completed its tightening cycle before September of the previous year, when inflation in the USA started to slow down. As a result, both central banks are raising their rates, but the Federal Reserve is doing it more aggressively and quickly, leading to continued appreciation of the euro.
Therefore, the consensus is that it is time for the euro to depreciate.
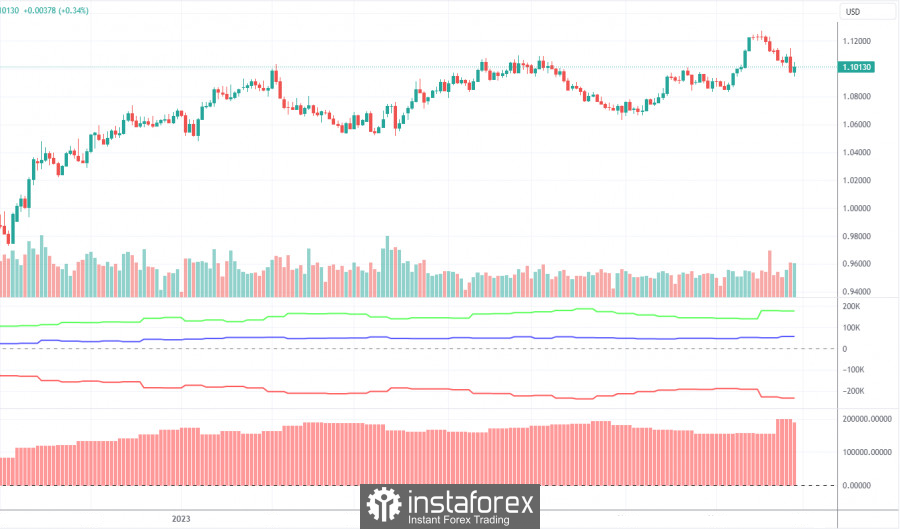
On Friday, a new COT report was released for July 25th. Over the last ten months, COT reports' data has consistently matched market trends. As indicated in the illustration, the net position of large players started to rise in September 2022, coinciding with the rise of the European currency. While the net position has shown a limited increase in the last 5–6 months, the euro remains high. The net position of non-commercial traders is still strongly bullish, leading to further appreciation of the European currency against the dollar in the long term.
Attention has been drawn to the fact that the relatively high value of the "net position" could imply the end of the upward trend. This is evident from the first indicator, where the significant divergence between the red and green lines often signals the end of a trend. During the last reporting week, the number of buy contracts among the "Non-commercial" group decreased by 13.8 thousand, and the number of shorts decreased by 12.2 thousand. Consequently, the net position decreased by another 1.6 thousand contracts. The significant difference between the number of buy and sell contracts among non-commercial traders, with the former exceeding 177 thousand, suggests a substantial gap. In principle, even without COT reports, it is evident that the euro should decrease, but the market is still not rushing to sell.
The outcomes of the Federal Reserve and ECB meetings can be summarized as follows: the market expected more but received less. Powell's readiness to raise the rate a few more times was not heard, and Christine Lagarde's announcement of a potential pause in rate hikes was unexpected. Consequently, the dollar fell after the Federal Reserve meeting, and the euro fell following the ECB meeting. Lagarde's words about a possible pause are considered significant, as they could be the starting point for a downward trend or a major correction. By the end of the year, the Federal Reserve may start hinting at easing monetary policy, which, in theory, should lead to a new decline in the American currency. Therefore, a correction would be favorable before this happens.
Explanations for the illustrations:
Price support and resistance levels, Fibonacci levels – these are the target levels when opening buy or sell positions. Take Profit levels can be placed around them.
Indicators: Ichimoku (default settings), Bollinger Bands (default settings), MACD (5, 34, 5).
Indicator 1 on the COT charts – the size of the net position for each category of traders.
Indicator 2 on the COT charts – the size of the net position for the "Non-commercial" group.
Díky analytickým přehledům společnosti InstaForex získáte plné povědomi o tržních trendech! Jako zákazníkovi společnosti InstaForex je Vám k dispozici velký počet bezplatných služeb umožňujících efektivní obchodování.

