 Zůstat
Obchodní podmínky
Nástroje


The sudden growth of the UK's GDP by 0.2% in the second quarter compared to the previous three months was unexpected for analysts who anticipated a zero change in the rate. This coincided with the release of data on the country's industrial production, which reached its highest level in three years. In June 2023, industrial production grew by 1.8% compared to the previous month, recovering from a 0.6% decline in the prior month. This significant surge in industrial activity exceeded market expectations by 0.1% and was the best since August 2020.
During the American trading session, producer prices in the United States were published, which in July rose above forecasts. These results indicate the possibility of further growth in the level of inflation in the U.S. In turn, the Federal Reserve might ultimately continue to raise interest rates. All these led to further strengthening of the dollar's positions in the market.
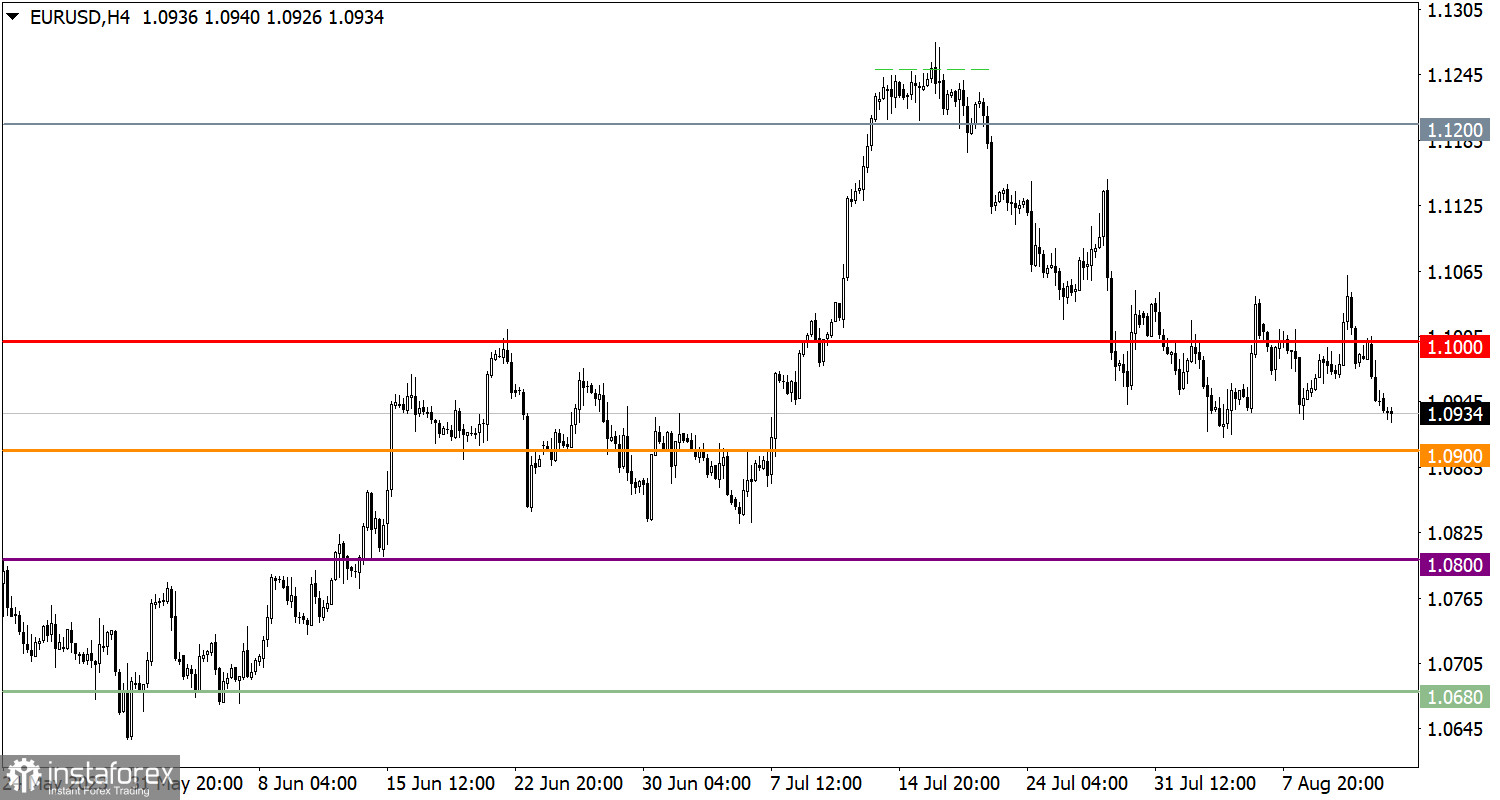
The EUR/USD currency pair again returned to the local low of the correction cycle during a rapid downward movement. This price movement indicates the possibility of further decline if a set of technical conditions aligns.
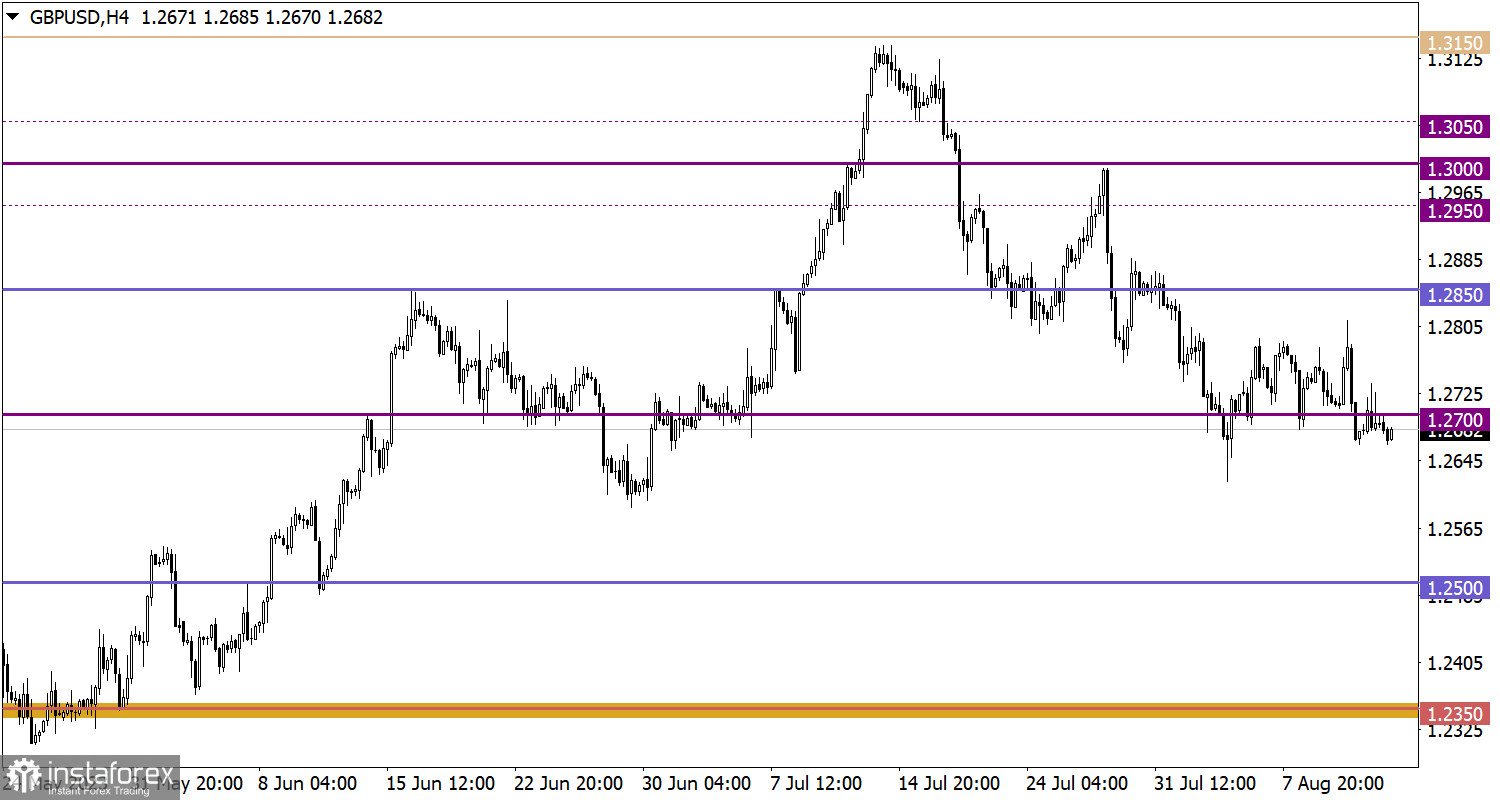
The GBP/USD currency pair maintains a downward sentiment despite a recent stagnation. Holding the price below the 1.2700 level suggests a prolongation of the correction cycle, although such a technical signal is absent at this stage.

Monday, as usual, is accompanied by an empty macroeconomic calendar. No major statistical data releases are expected in the European Union, the United Kingdom, or the United States.
In this context, investors and traders are likely to rely on incoming news and information flows to make market decisions.
For a further increase in the volume of short positions, it is essential to stay below the 1.0900 level. In this scenario, there could be a sequential weakening of the euro, leading it to reach values around 1.0850 or 1.0800. An alternative scenario contemplates a price rebound from the 1.0900 level, similar to the previous movement that occurred on August 3.
For a further increase in the volume of short positions, it's enough for the price to drop below the 1.2650 level. If such a movement occurs, there's a high probability of the continuation of the current corrective downward movement. However, until then, there's a possibility that the exchange rate will form a stagnation (sideways movement) near the 1.2700 level.
The candlestick chart type is white and black graphic rectangles with lines above and below. With a detailed analysis of each individual candle, you can see its characteristics relative to a particular time frame: opening price, closing price, intraday high and low.
Horizontal levels are price coordinates, relative to which a price may stop or reverse its trajectory. In the market, these levels are called support and resistance.
Circles and rectangles are highlighted examples where the price reversed in history. This color highlighting indicates horizontal lines that may put pressure on the asset's price in the future.
The up/down arrows are landmarks of the possible price direction in the future.
Díky analytickým přehledům společnosti InstaForex získáte plné povědomi o tržních trendech! Jako zákazníkovi společnosti InstaForex je Vám k dispozici velký počet bezplatných služeb umožňujících efektivní obchodování.

