 Zůstat
Obchodní podmínky
Nástroje


Preliminary estimates of business activity indices in the Eurozone, the United Kingdom, and the United States turned out to be significantly worse than expected. In the Eurozone, the services activity plummeted from 50.9 to 48.3, against the forecast of 50.7. Meanwhile, the manufacturing index, on the other hand, rose from 42.7 to 43.7, against a forecast of 42.6. As a result, the composite business activity index fell from 48.6 to 47 instead of the projected 48.5.
The European currency reacted with a decline in value to this data.
In the United Kingdom, the situation proved even worse than in the EU. The manufacturing activity plummeted from 45.3 to 42.5, versus forecast of 45.2. The service sector also deteriorated, collapsing from 51.5 to 48.7 versus the projected decline to 50.5. This led to a drop in the composite business activity index from 50.8 to 47.9.
The British pound also responded with a decrease in value to these statistical data.
In the United States, the situation is no better. The services PMI fell from 52.2 to 51.0, while manufacturing PMI dropped from 49.0 to 47.0. The composite business activity index also declined from 52.0 to 40.40 despite expectations of 52.0.
The publication of this data caused a decline in the position of the U.S. dollar in the market.
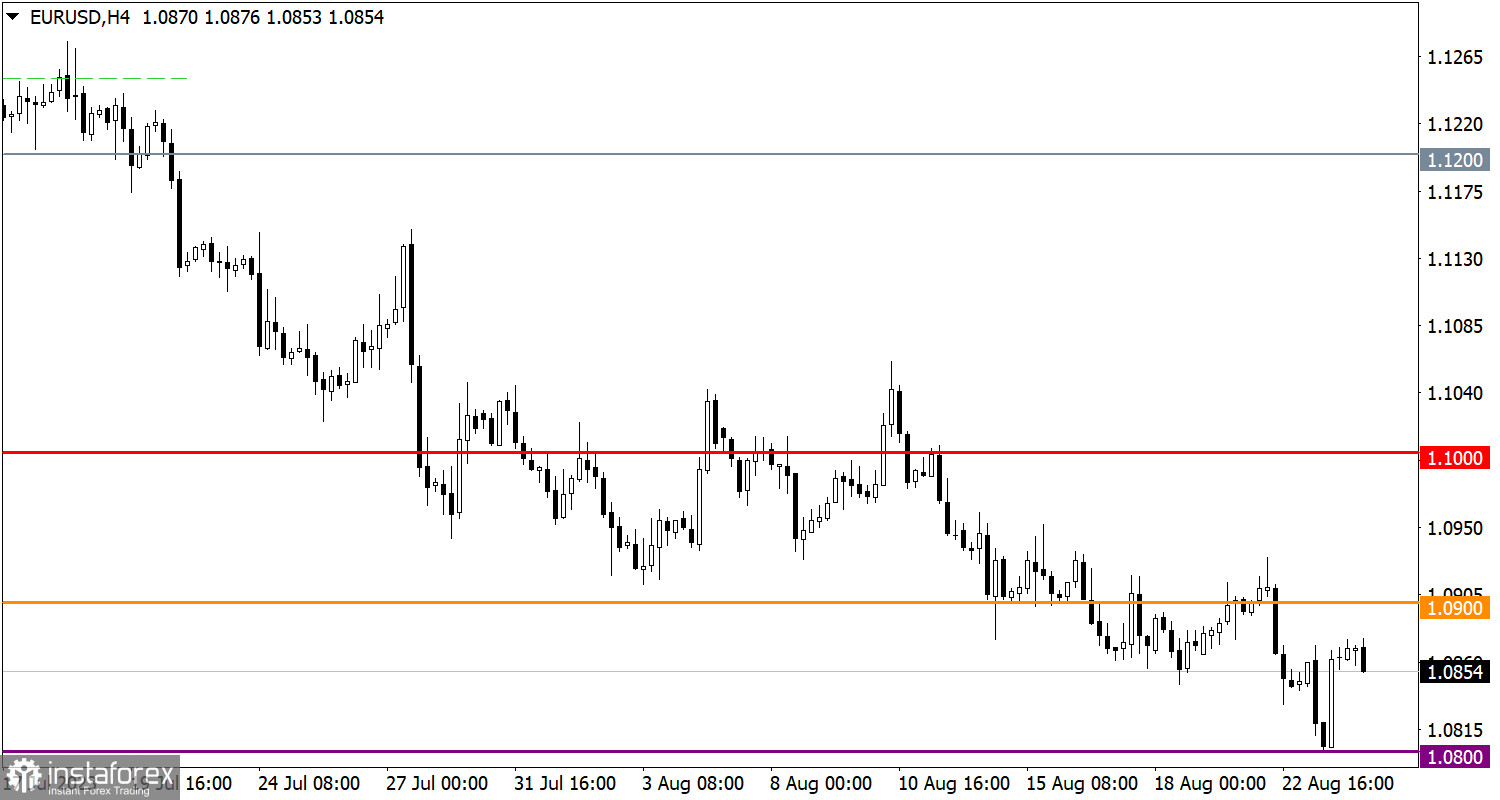
The EUR/USD exchange rate reduced the volume of short positions near the support level of 1.0800. This factor triggered an upward price movement and a partial recovery rate after the recent decline.
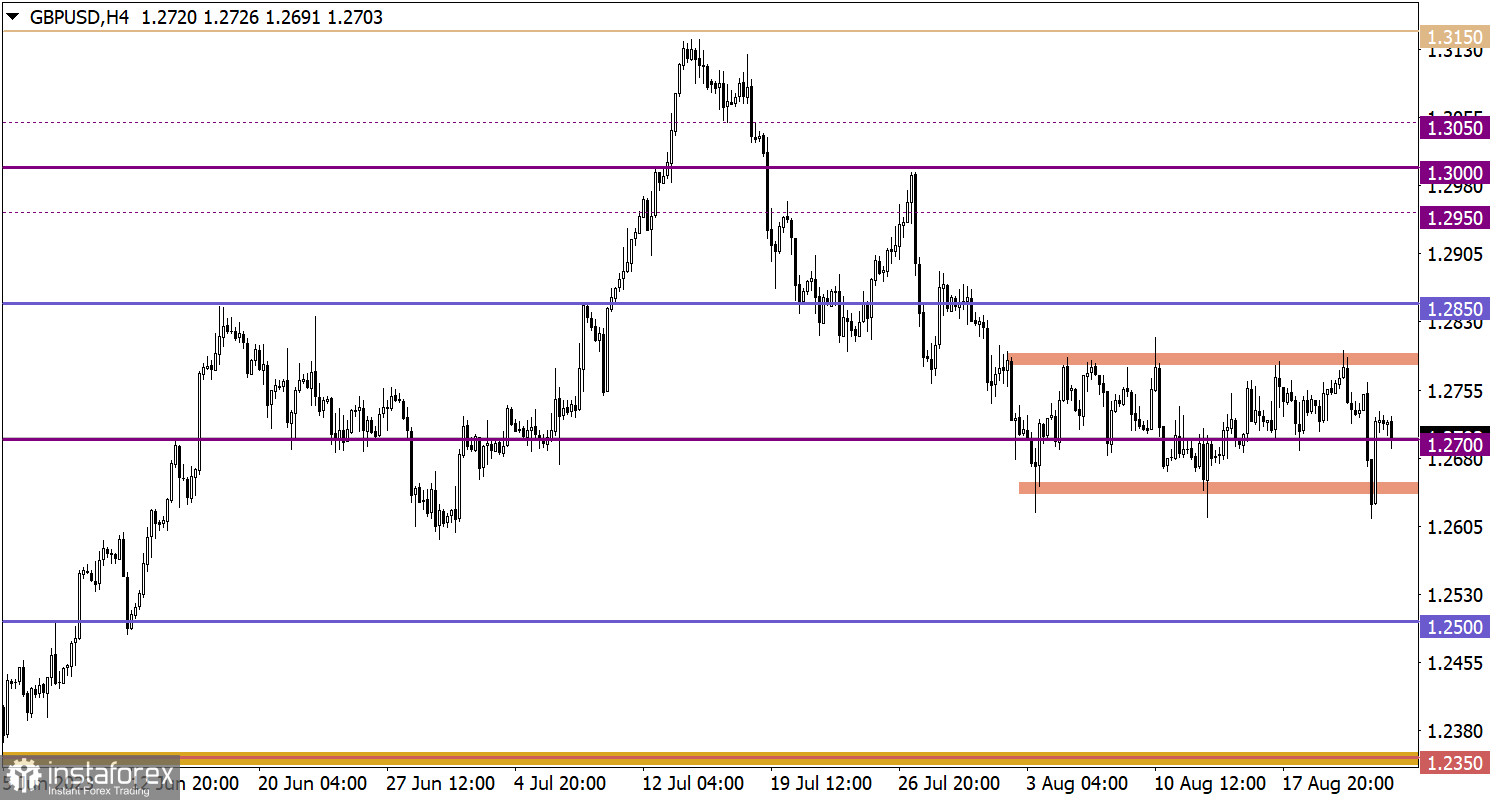
During the bearish rally of the British pound, it temporarily dipped below the lower border of the sideways channel 1.2650/1.2800. However, despite this, maintaining the quote at the new levels proved unstable. This led to a reversal, and as a result, the rate returned within the limits of the previous range.

Today, data on U.S. jobless claims will be released, where a decrease in their overall figure is anticipated. Detailed statistical data suggests that the volume of continuing claims may decline from 1.716 million to 1.708 million, while the volume of initial claims may slightly rise from 239,000 to 240,000.
Time Targeting:
U.S. Jobless Claims – 12:30 UTC
At the moment, the downward cycle that began from the peak of the medium-term trend remains dominant in the market despite the current pullback. This indicates that a return of the price to the support level of 1.0800 might signal a potential breakout of this level. Such a move will likely lead to the continuation of the downward movement. On the other hand, to generate an initial signal of a possible end to the downward cycle, it is essential to first raise the quote above the 1.0950 mark.
Currently, the strategy continues to rely on the current range between the levels 1.2650 and 1.2800. To get a clearer signal of the end of this range, it's important for the price to remain either above or below one of its borders throughout the day. In such a scenario, the most reliable technical signal regarding the subsequent price movement may emerge.
The candlestick chart type is white and black graphic rectangles with lines above and below. With a detailed analysis of each individual candle, you can see its characteristics relative to a particular time frame: opening price, closing price, intraday high and low.
Horizontal levels are price coordinates, relative to which a price may stop or reverse its trajectory. In the market, these levels are called support and resistance.
Circles and rectangles are highlighted examples where the price reversed in history. This color highlighting indicates horizontal lines that may put pressure on the asset's price in the future.
The up/down arrows are landmarks of the possible price direction in the future.
Díky analytickým přehledům společnosti InstaForex získáte plné povědomi o tržních trendech! Jako zákazníkovi společnosti InstaForex je Vám k dispozici velký počet bezplatných služeb umožňujících efektivní obchodování.

