 Zůstat
Obchodní podmínky
Nástroje


On Monday, the macroeconomic calendar was traditionally empty. No significant statistical data were published. Also, due to a national holiday in the United States, banks, funds, and exchanges were closed.
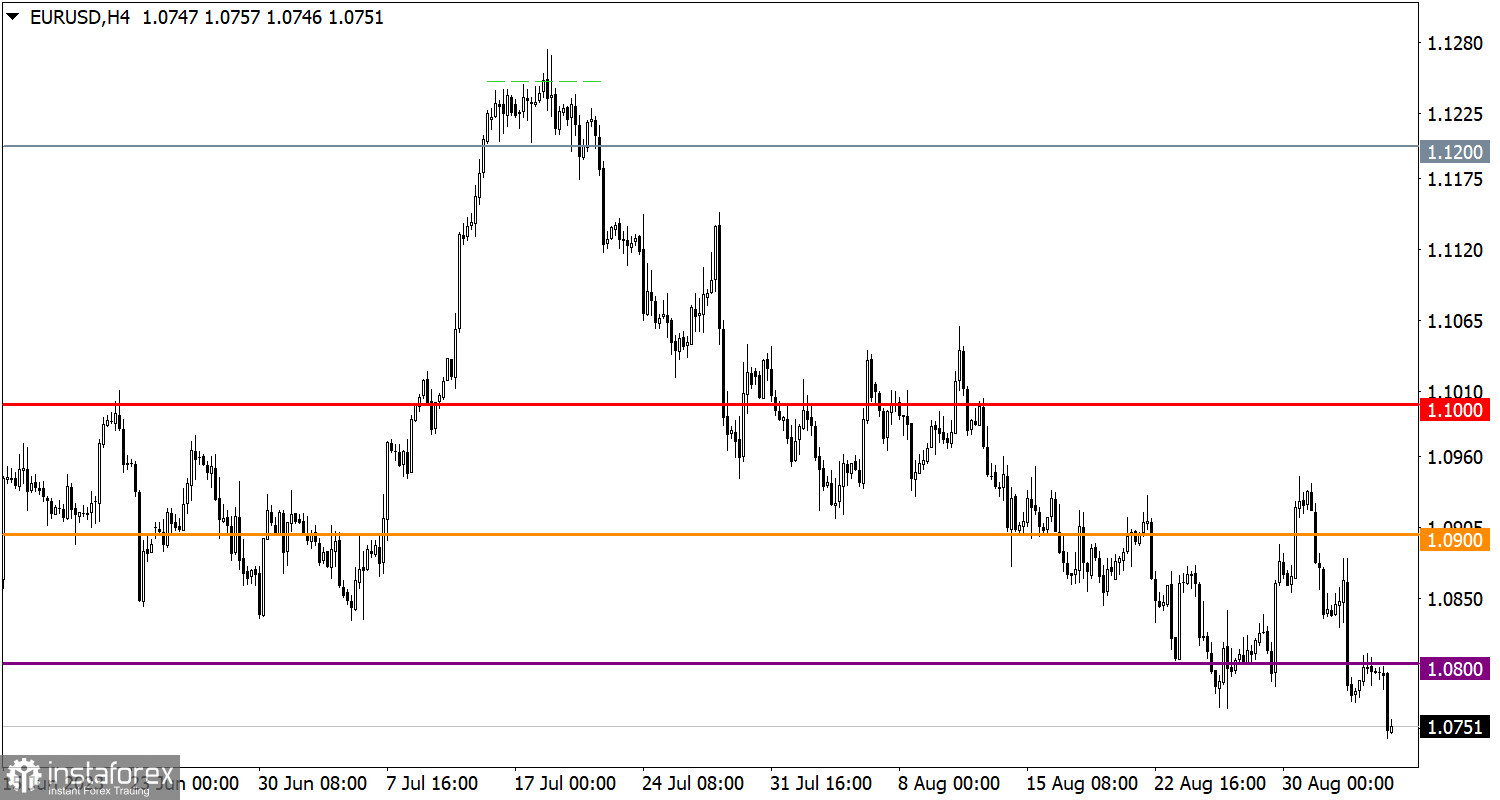
The EUR/USD currency pair slowed down its recovery phase around the 1.0800 level, where the volume of long positions decreased. As a result, a new downward movement in the exchange rate occurred.
The GBP/USD pair slightly recovered previously lost positions after the recent downward rally. However, there are no radical changes, and the chart still shows a downward cycle established in July.

According to analysts' forecasts, the Eurozone Producer Price Index (PPI) would decline from -3.4% to -7.8%, implying a sharp slowdown in inflation and, consequently, the possibility of easing the monetary policy of the European Central Bank (ECB). However, recent preliminary inflation data had already hinted that the actual figures might differ from expectations. In fact, the difference turned out to be insignificant: the rate of decline in producer prices accelerated to -7.6%.
This indicates that changes in producer prices do not always immediately affect consumer prices. Thus, eurozone inflation is likely to continue to decline, possibly quite rapidly. On the one hand, this is positive. However, from a financial market perspective, it also means that the European Central Bank will not rush to raise interest rates. If the situation does not change, this could even lead to a postponement of rate hikes indefinitely. This, in turn, could support the dollar, which has already begun to strengthen actively. Given its growth dynamics, we may see some pullback during the American trading session.
Since the opening of the European session, there has been a new local low in the downward cycle. As a result, the volume of short positions increased, allowing for an acceleration of the decline. A stable price below the 1.0750 level allows further growth in the volume of short positions in the euro. As for the alternative scenario, it would require the exchange rate to return above the 1.0800 level first. Only after this will a primary signal of a slowdown in the downward cycle appear.
For the subsequent growth in the volume of short positions, a stable price retention below the 1.2550 level is necessary. In this case, a technical signal for the extension of the downward cycle may occur. Otherwise, the possibility of a sideways amplitude around the existing base is considered.

The candlestick chart type is white and black graphic rectangles with lines above and below. With a detailed analysis of each individual candle, you can see its characteristics relative to a particular time frame: opening price, closing price, intraday high and low.
Horizontal levels are price coordinates, relative to which a price may stop or reverse its trajectory. In the market, these levels are called support and resistance.
Circles and rectangles are highlighted examples where the price reversed in history. This color highlighting indicates horizontal lines that may put pressure on the asset's price in the future.
The up/down arrows are landmarks of the possible price direction in the future.
Díky analytickým přehledům společnosti InstaForex získáte plné povědomi o tržních trendech! Jako zákazníkovi společnosti InstaForex je Vám k dispozici velký počet bezplatných služeb umožňujících efektivní obchodování.


