 Zůstat
Obchodní podmínky
Nástroje


According to analysts' forecasts, the Eurozone Producer Price Index (PPI) would decline from -3.4% to -7.8%, implying a sharp slowdown in inflation and, consequently, the possibility of easing the monetary policy of the European Central Bank (ECB). However, recent preliminary inflation data had already hinted that the actual figures might differ from expectations. In fact, the difference turned out to be insignificant: the rate of decline in producer prices accelerated to -7.6%.
This indicates that changes in producer prices do not always immediately affect consumer prices. Thus, eurozone inflation is likely to continue to decline, possibly quite rapidly. On the one hand, this is positive. However, from a financial market perspective, it also means that the European Central Bank will not rush to raise interest rates. If the situation does not change, this could even lead to a postponement of rate hikes indefinitely.
The EUR/USD currency pair continued to move downward within the current downward cycle. The quote has almost reached the 1.0700 mark, which was last recorded in June of this year.
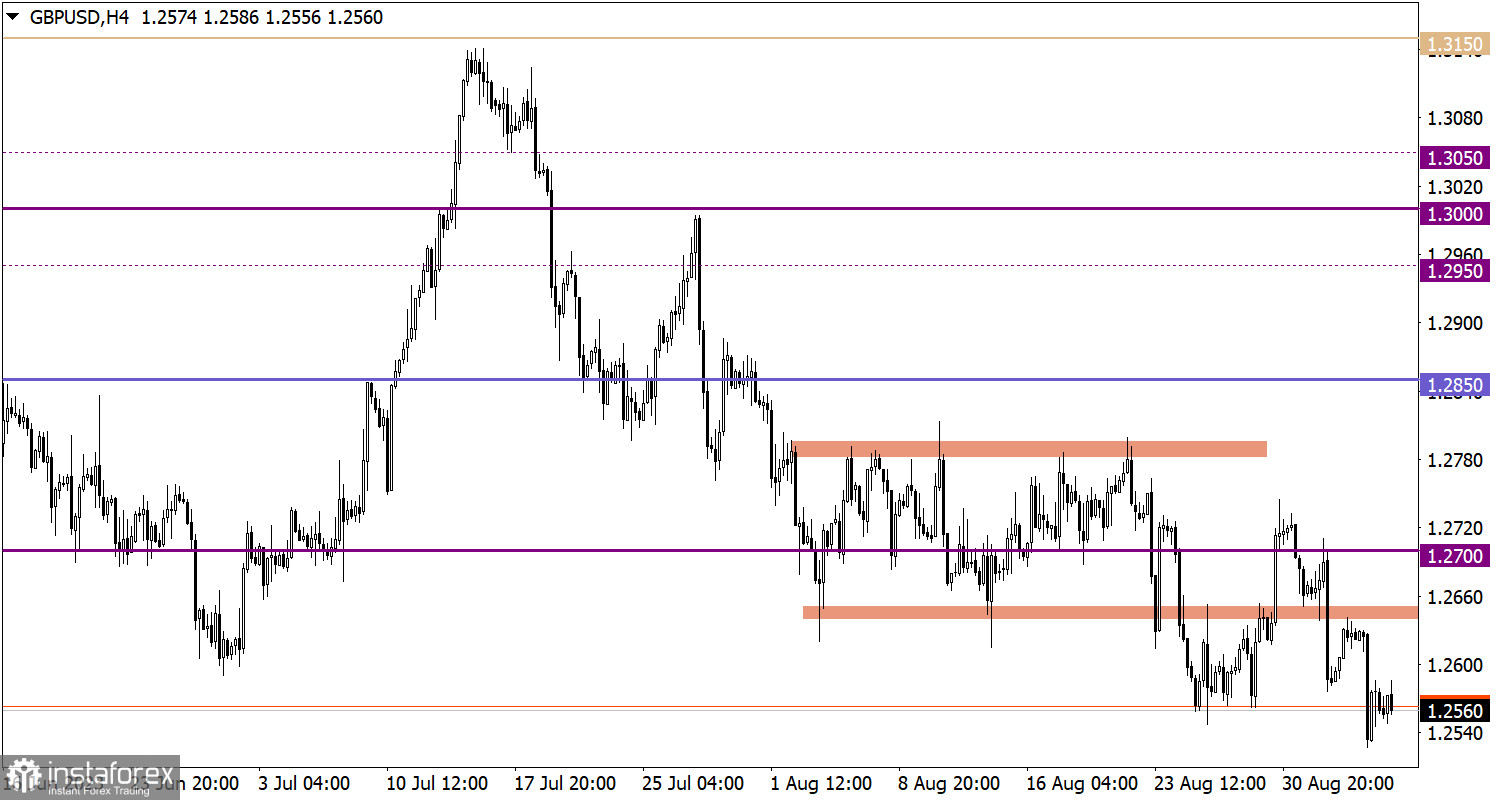
The GBP/USD currency pair also continued its downward trajectory. Over the past seven weeks, the pound has declined by over 600 points.

Today, data on retail sales in the European Union is expected to be published, where a slowdown in the rate of decline from -1.4% to -1.1% is anticipated. Despite consumer activity still decreasing and being a key driver of economic growth, given the clear oversold condition of the euro, even a slight improvement in the situation could be a basis for a minor euro recovery. This is why euro growth in line with forecasts is considered the most likely scenario.
Considering the significant weakening of the euro, one could assume that the medium-term trend may change if the current downward movement continues in the market. However, there is a significant support level around 1.0650/1.0700 that has previously served as an incentive for long positions in the euro. Therefore, until this level is overcome, there is a possibility of a price pullback.

Although there is oversold conditions for the British currency, maintaining the price below the 1.2550 level steadily could lead to further increases in short positions. In this case, speculators may ignore the technical signal of oversold conditions, which, in turn, could cause additional weakening of the pound sterling exchange rate. Meanwhile, the bullish scenario is currently viewed by traders more as a temporary pullback after the recent decline.
The candlestick chart type is white and black graphic rectangles with lines above and below. With a detailed analysis of each individual candle, you can see its characteristics relative to a particular time frame: opening price, closing price, intraday high and low.
Horizontal levels are price coordinates, relative to which a price may stop or reverse its trajectory. In the market, these levels are called support and resistance.
Circles and rectangles are highlighted examples where the price reversed in history. This color highlighting indicates horizontal lines that may put pressure on the asset's price in the future.
The up/down arrows are landmarks of the possible price direction in the future.
Díky analytickým přehledům společnosti InstaForex získáte plné povědomi o tržních trendech! Jako zákazníkovi společnosti InstaForex je Vám k dispozici velký počet bezplatných služeb umožňujících efektivní obchodování.

