 Zůstat
Obchodní podmínky
Nástroje


Negative statistical data about the United Kingdom were published on Friday, which intensified the sale of the British currency. The pace of retail sales decline slowed from -3.1% to -1.4%, not meeting forecasts at the level of 1.3%. At the same time, the business activity index in the manufacturing sector increased from 43.0 points to 44.2 points, but an increase to 44.0 points was expected. However, the business activity index in the services sector significantly decreased from 49.5 points to 47.2 points, instead of the expected growth to 49.6 points. The composite business activity index also fell from 48.6 points to 46.8 points.
In the European Union, the business activity index in the manufacturing sector fell from 43.5 points to 43.4 points, while it was expected to rise to 44.0 points. The business activity index in the services sector increased from 47.9 points to 48.4 points. The composite business activity index also increased from 46.7 points to 47.1 points.
Note that the statistics for the European Union were slightly better than those for the United Kingdom, which helped the euro maintain its position.
During the American trading session, a preliminary assessment of business activity indices in the United States was published, which turned out to be lower than expected. The business activity index in the manufacturing sector increased from 47.9 points to 48.9 points, with a forecast of 48.0 points. However, the business activity index in the services sector decreased to 50.2 points instead of the expected rise from 50.5 points to 50.6 points. Considering that this index carries more weight, it contributed to a decrease in the composite business activity index from 50.2 points to 50.1 points.
The EUR/USD currency pair set a local low during a downward cycle. Afterward, a consolidation of different types of doji candles formed in the base area, leading to a stagnation.
The GBP/USD pair is under pressure from sellers, resulting in an inertial movement that updates the local low of the downward cycle.
Monday, as usual, comes with an empty macroeconomic calendar. The publication of significant statistical data in the European Union, the United Kingdom, and the United States is not expected.
As a result, investors and traders are likely to rely on incoming news flow to make market decisions.
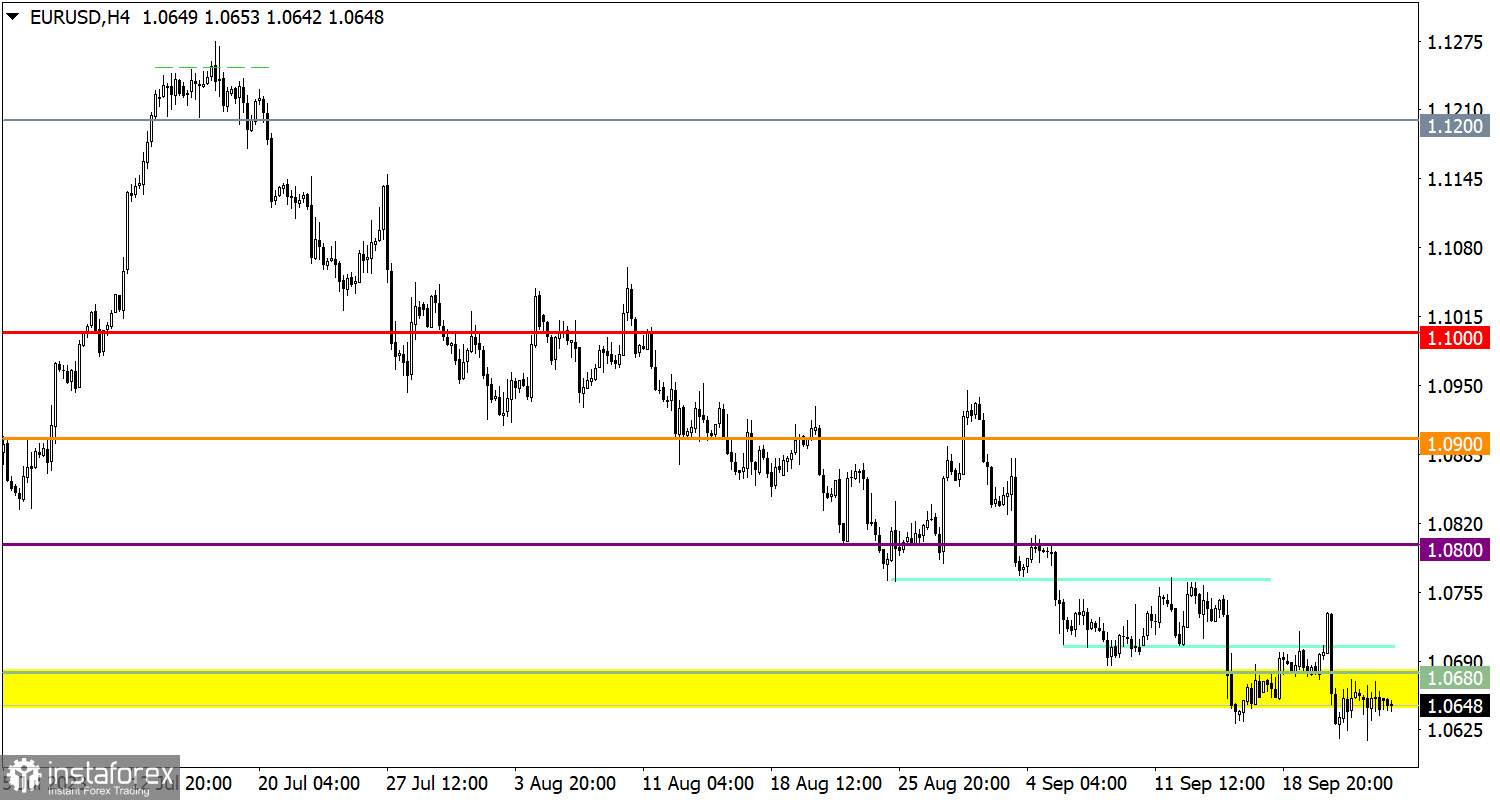
Such stagnation is usually classified as a stage of characteristic uncertainty among market participants. Speculative activity may arise as a result, leading to the conclusion of the ongoing stagnation. In the case of considering a downward scenario, maintaining the price below 1.0600 could lead to an increase in short positions towards the level of 1.0500. In the case of an upward scenario, there is a possibility of a pullback relative to the downward cycle. An increase in long positions may occur if the price returns above the level of 1.0650.
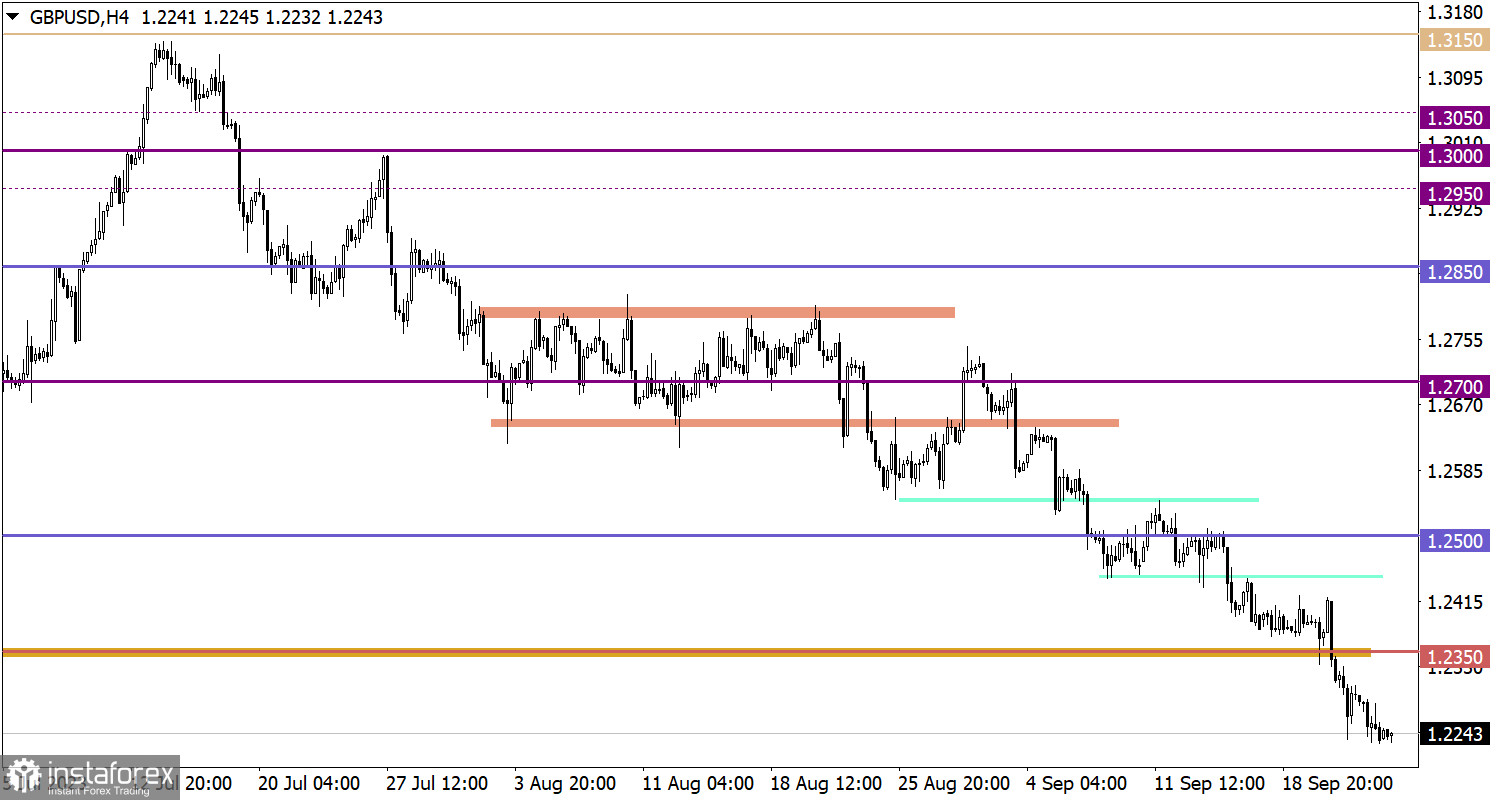
Market participants are ignoring the oversold status; otherwise, a technical rebound would have already occurred at this stage. In the event that momentum persists in the market, the quote could easily decrease to the level of 1.2150. However, the longer speculators ignore the oversold status, the more aggressively short positions may be closed, leading to a sharp rebound.
The candlestick chart type is white and black graphic rectangles with lines above and below. With a detailed analysis of each individual candle, you can see its characteristics relative to a particular time frame: opening price, closing price, intraday high and low.
Horizontal levels are price coordinates, relative to which a price may stop or reverse its trajectory. In the market, these levels are called support and resistance.
Circles and rectangles are highlighted examples where the price reversed in history. This color highlighting indicates horizontal lines that may put pressure on the asset's price in the future.
The up/down arrows are landmarks of the possible price direction in the future.
Díky analytickým přehledům společnosti InstaForex získáte plné povědomi o tržních trendech! Jako zákazníkovi společnosti InstaForex je Vám k dispozici velký počet bezplatných služeb umožňujících efektivní obchodování.


