 Zůstat
Obchodní podmínky
Nástroje


On Tuesday, with the opening of the European trading session, data on the UK labor market were published, showing that the unemployment rate remained at 4.2% despite expectations of an increase to 4.3%. The number of employed in September increased by 54,000 people, while a reduction of 198,000 was expected. These labor market data turned out to be better than forecasts, leading to further strengthening of the British pound.
However, the key event on Tuesday, and possibly for the entire week, was the inflation data in the United States, where the inflation rate slowed to 3.2%. The actual figure turned out to be better than analysts' expectations, who anticipated a decline to 3.3%. These data increased confidence that the Federal Reserve will no longer raise interest rates and will soon announce a cycle of rate cuts. The market's reaction was corresponding, and dollar positions came under selling pressure.
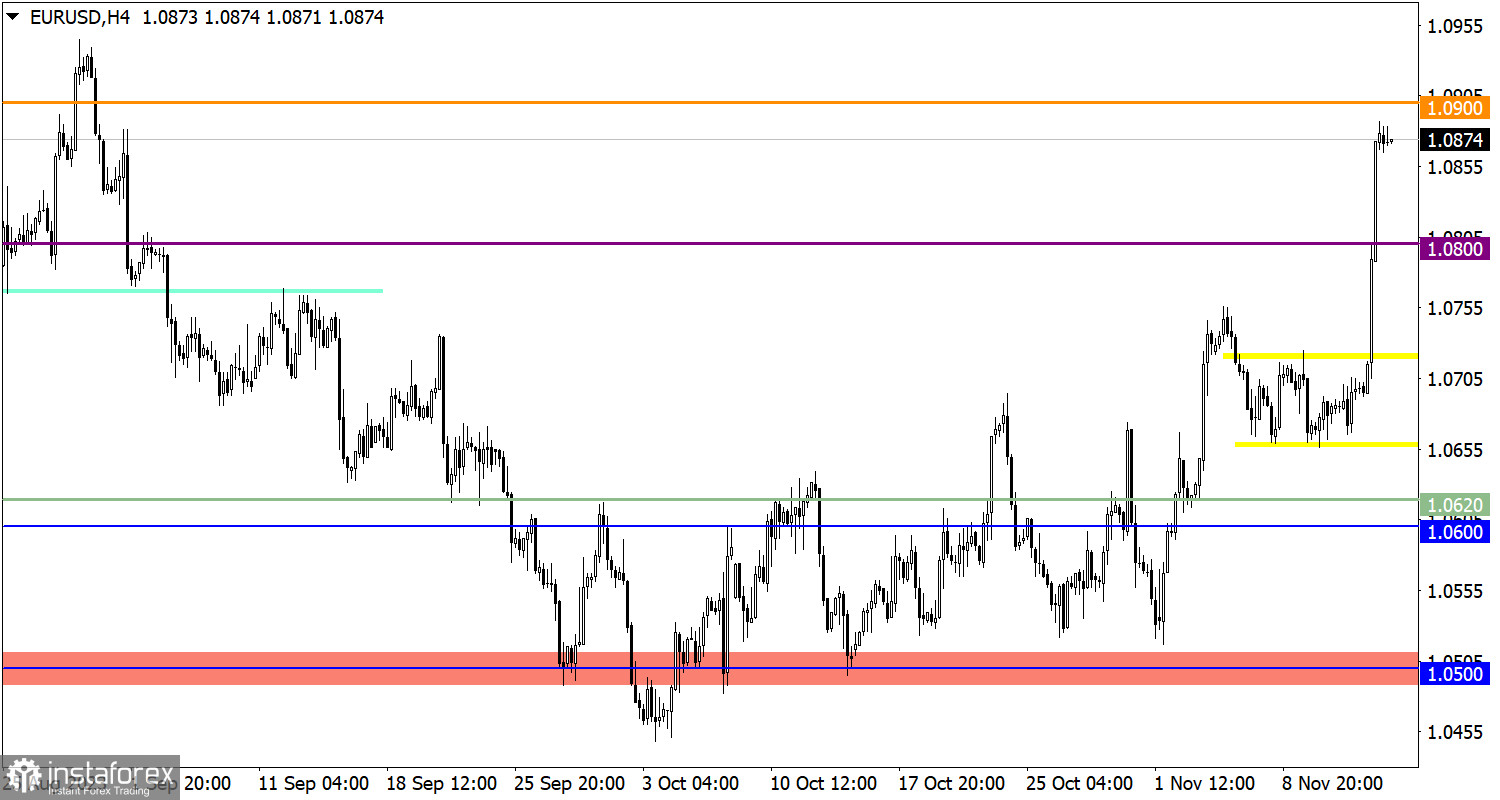
The EURUSD currency pair demonstrated a strong price change against the backdrop of U.S. inflation data, with the quote jumping by almost 1.7%, about 190 points. As a result, not just a sideways trend was completed, but a full-fledged technical signal of a recovery in euro positions relative to the recent correction.
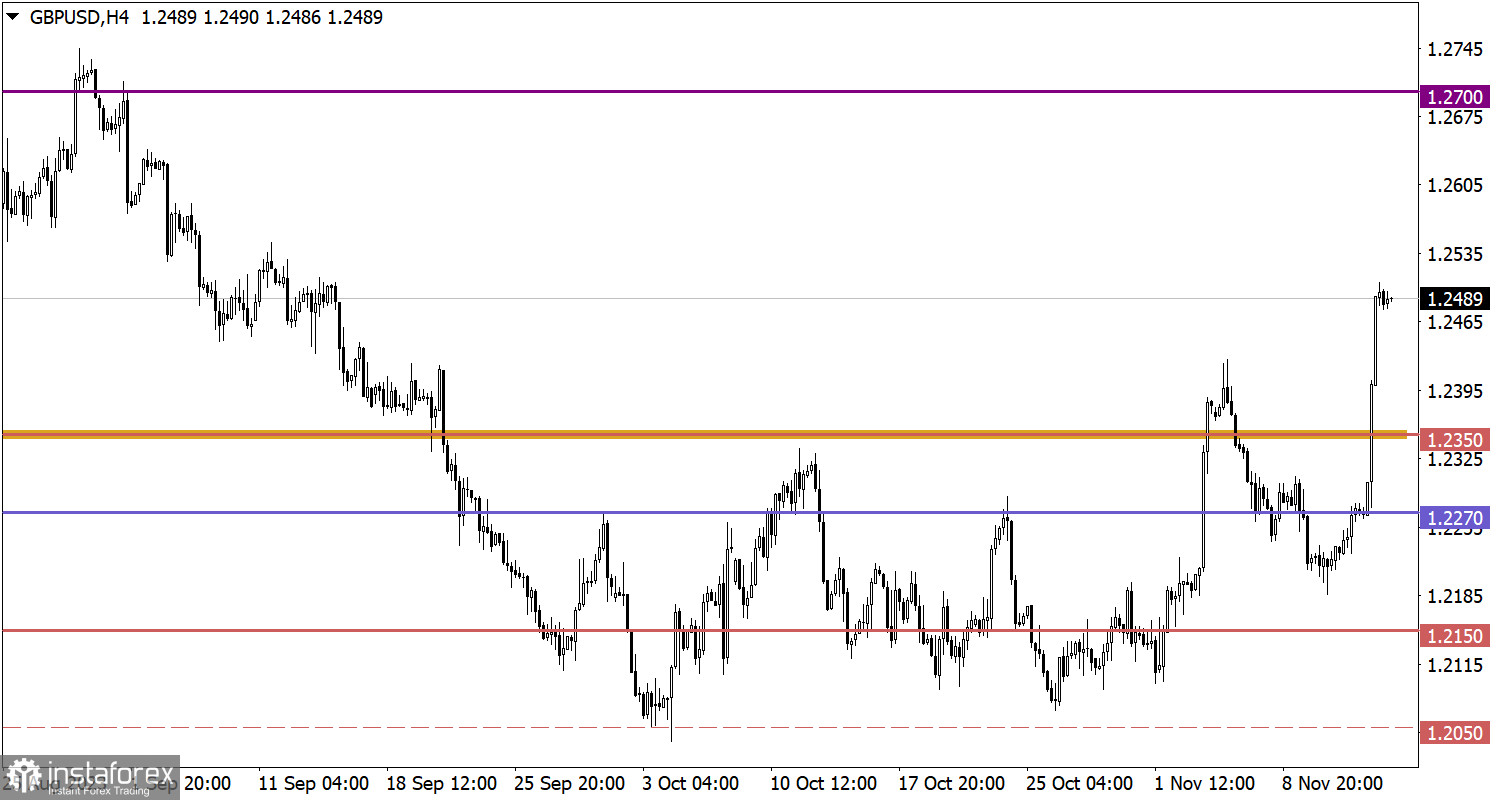
Amid widespread selling of dollar positions, the GBP/USD showed a truly strong upward move. At its peak, the exchange rate strengthened by approximately 1.8%, about 230 points, leading to touching the level of 1.2500.

With the opening of the European trading session, inflation data in the UK were published. So, the consumer price index dropped to 4.6% with a forecast of 4.8%. Based on the new data, it is highly likely that the Bank of England will not raise the interest rate.
During the American trading session, data on retail sales in the United States is expected to be published. Analysts expect a slowdown from 3.8% to 2.1%. These are negative data for the U.S. economy, thereby dollar positions may again shift towards weakening.
In this situation, the euro exchange rate is overbought in intraday and short-term periods. This signal was caused by an intense upward move. Therefore, a price pullback may occur, with a partial recovery of dollar positions towards the level of 1.0800. As for the subsequent upward cycle, it is considered inertial, where speculators will ignore technical signals of overbought euro. In this case, maintaining the price above the level of 1.0900 may indicate a subsequent rise in the volume of long positions.
Taking into account the colossal level of overbought pound sterling, it can be assumed that a pullback stage is imminent. In this scenario, there may be a partial recovery of dollar positions towards the level of 1.2350.
However, an alternative scenario considers a prolonged upward cycle due to the inertial move, where speculators will ignore the technical signal of overbought sterling. This scenario will be relevant in the market if the price stabilizes above the level of 1.2500.
The candlestick chart type is white and black graphic rectangles with lines above and below. With a detailed analysis of each individual candle, you can see its characteristics relative to a particular time frame: opening price, closing price, intraday high and low.
Horizontal levels are price coordinates, relative to which a price may stop or reverse its trajectory. In the market, these levels are called support and resistance.
Circles and rectangles are highlighted examples where the price reversed in history. This color highlighting indicates horizontal lines that may put pressure on the asset's price in the future.
The up/down arrows are landmarks of the possible price direction in the future.
Díky analytickým přehledům společnosti InstaForex získáte plné povědomi o tržních trendech! Jako zákazníkovi společnosti InstaForex je Vám k dispozici velký počet bezplatných služeb umožňujících efektivní obchodování.


