 Zůstat
Obchodní podmínky
Nástroje


Inflation data for the United Kingdom was released. The Consumer Price Index fell to 4.6%, while the expected level was 4.9%. Based on the new data, it is highly likely that the Bank of England will not raise the interest rate.
A bit later, industrial production data in the EU was released, showing an accelerated decline from -5.1% to -6.9%, worse than the forecast of -6.2%. This is a negative factor for the EU economy, which is already facing serious difficulties.
During the U.S. trading session, retail sales data in the United States were released. The growth rate slowed from 4.1% to 2.5%, while a slowdown from 3.8% to 2.1% was expected. These data not only exceeded the forecast, but also the previous indicators were revised upwards. The U.S. dollar received support from buyers based on positive statistical data.

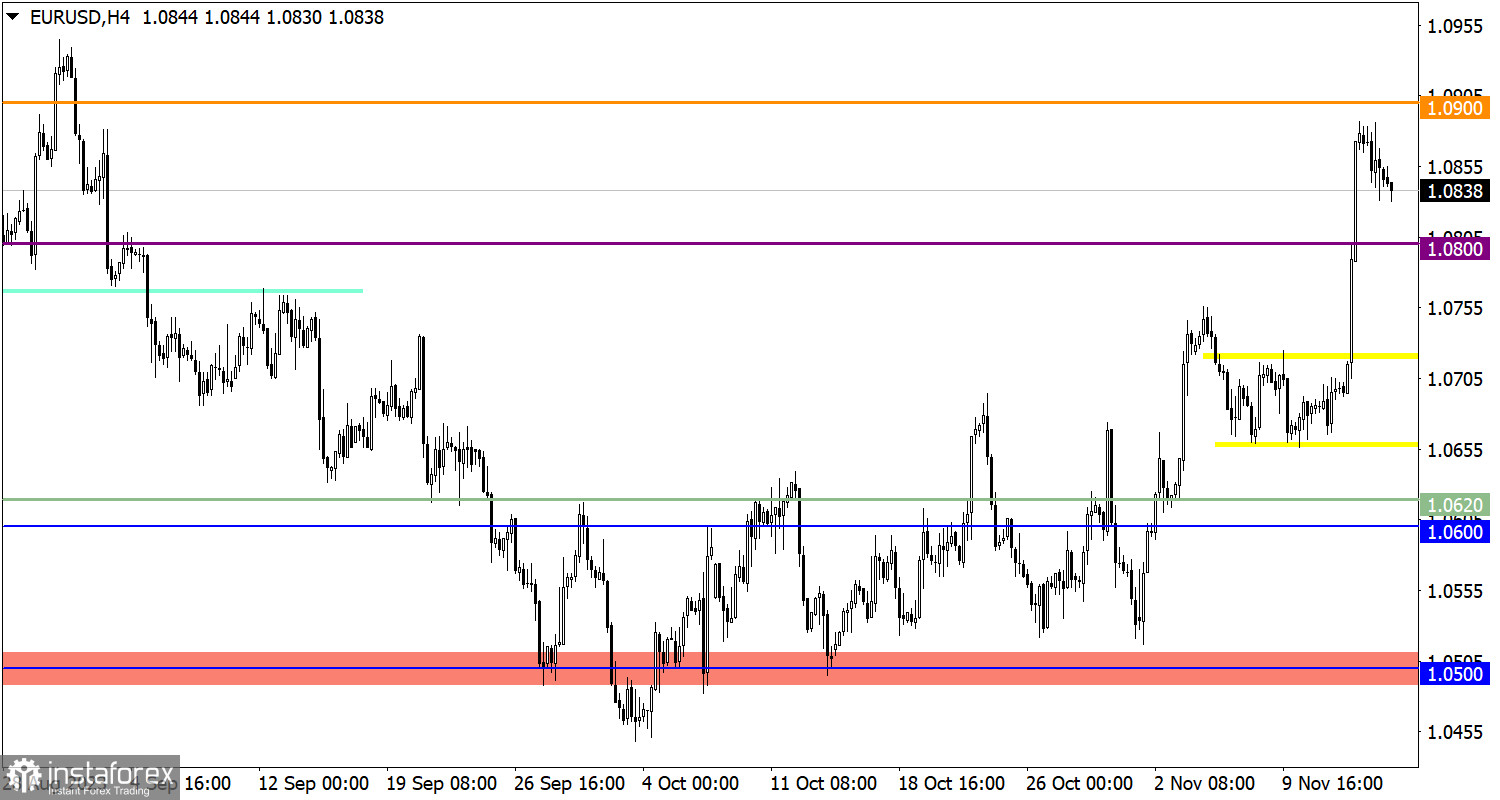
The EUR/USD currency pair entered a pullback stage amid high level of overbought conditions. The level of 1.0900 serves as resistance, near which there was a reduction in the volume of long positions.
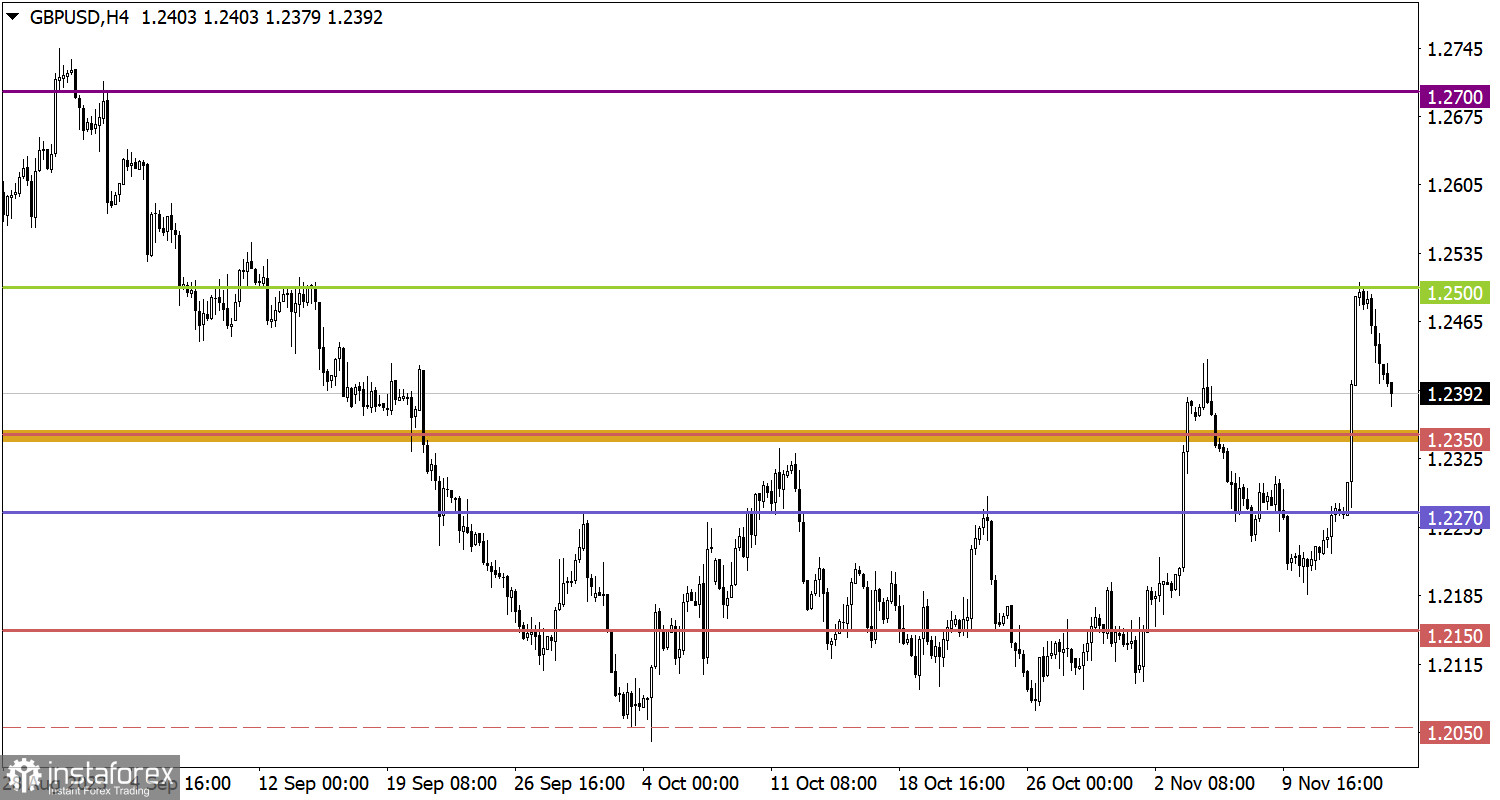
The GBP/USD currency pair shows a similar technical picture. First, there was a signal of overbought conditions for the pound, then the resistance level at 1.2500 was reached. Near this level, there is a decline in the volume of long positions, leading to a price pullback.
Today, data on unemployment benefit claims in the United States is expected to be published, where an overall increase in their indicator is predicted. Statistical data details indicate that the volume of continuing claims for benefits may rise from 1.834 million to 1.847 million, and the volume of initial claims for benefits may rise from 217,000 to 220,000.
Time Targeting
United States Jobless Claims – 13:30 UTC
The ongoing pullback is still present in the market, which is why traders are considering a scenario of movement towards the level of 1.0800. The further course of events will depend on the price behavior near this level: whether sellers can keep the quote below it, or the level will be used as support.
At the moment, the pullback has already exceeded +100 points from the level of 1.2500. In case of maintaining a downward trend during the pullback, further decline to the support level of 1.2350 is possible. Further movement will also be influenced by the price near the control level of 1.2350.
The candlestick chart type is white and black graphic rectangles with lines above and below. With a detailed analysis of each individual candle, you can see its characteristics relative to a particular time frame: opening price, closing price, intraday high and low.
Horizontal levels are price coordinates, relative to which a price may stop or reverse its trajectory. In the market, these levels are called support and resistance.
Circles and rectangles are highlighted examples where the price reversed in history. This color highlighting indicates horizontal lines that may put pressure on the asset's price in the future.
The up/down arrows are landmarks of the possible price direction in the future.
Díky analytickým přehledům společnosti InstaForex získáte plné povědomi o tržních trendech! Jako zákazníkovi společnosti InstaForex je Vám k dispozici velký počet bezplatných služeb umožňujících efektivní obchodování.


