 Zůstat
Obchodní podmínky
Nástroje


Analysis of Tuesday's Transactions:
1-hour chart of the EUR/USD pair.
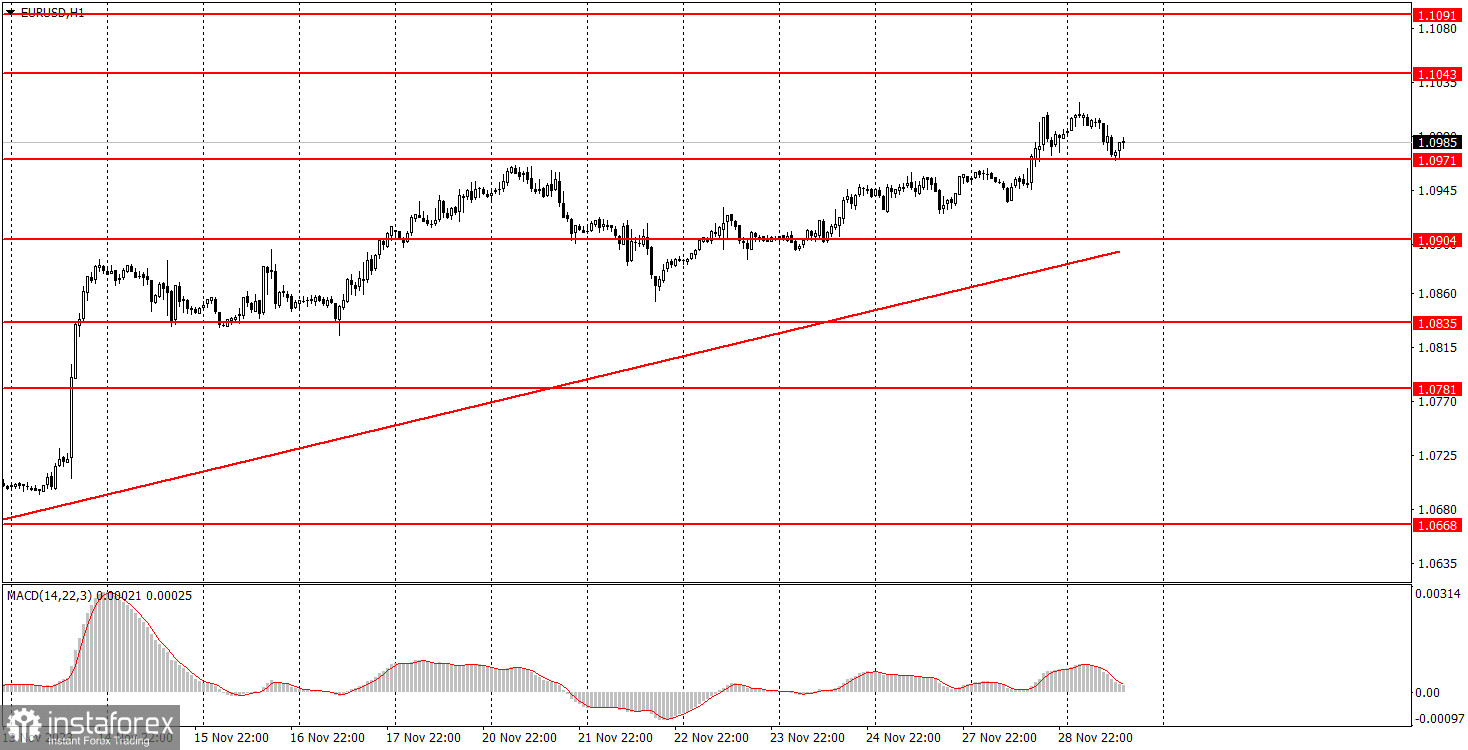
The currency pair EUR/USD continued its upward movement on Tuesday. Should we once again emphasize that the pair had no grounds for this? We mean fundamental and macroeconomic reasons. Throughout yesterday, novice traders could only pay attention to a series of speeches by representatives of the ECB and the Fed. However, none of the officials shared important information with the market. They all repeatedly say the same things: it is still too early to declare victory over inflation, the interest rate may be raised if necessary, and there are upward risks for inflation. The market has long known all this and has even memorized it. Therefore, such statements have no benefit.
From a technical point of view, the upward trend persists. Since the price continues to stay above the upward trend line, there is no reason to expect a strong decline in the pair now. Such reasons only exist if we recall the groundlessness of the current northward movement.
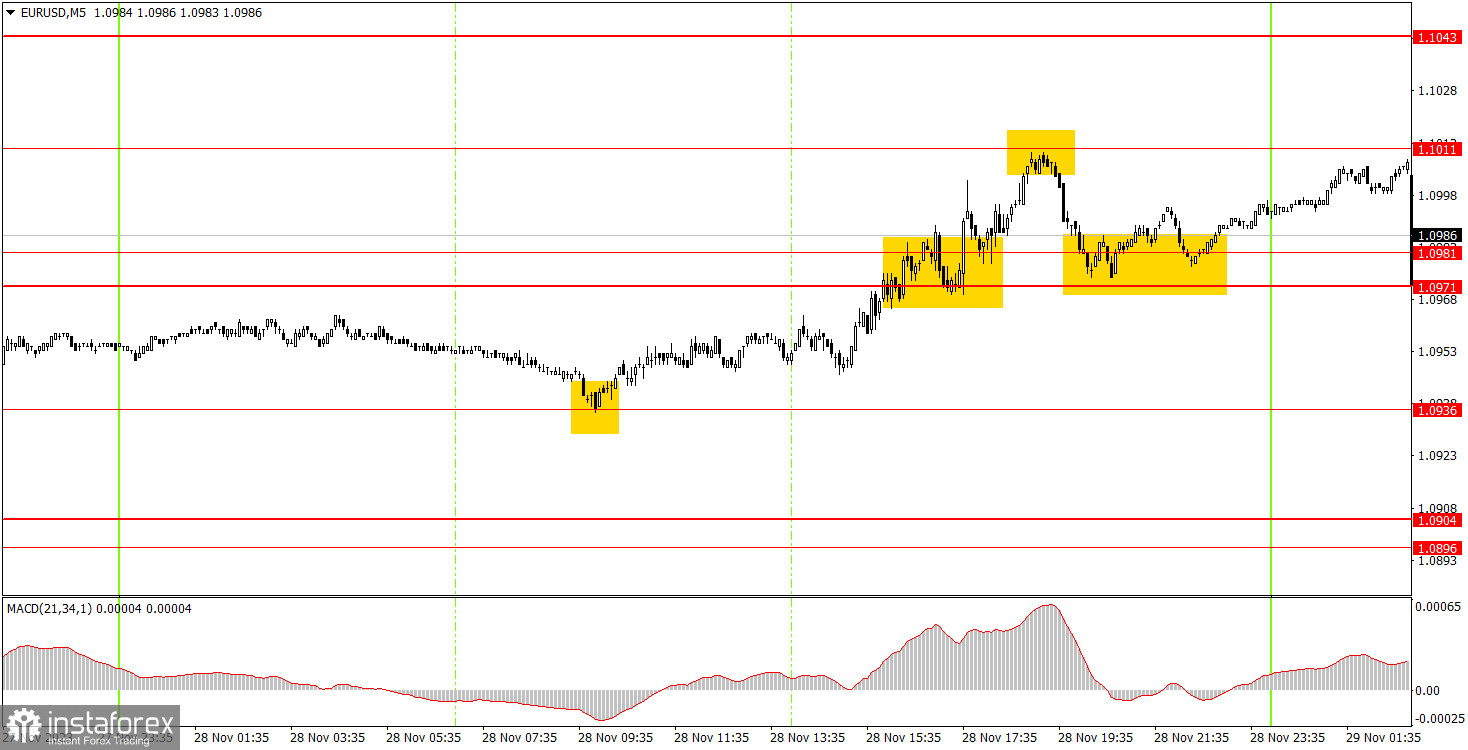
In the 5-minute timeframe, several good trading signals were formed yesterday, which should have been worked out. During the European trading session, the price bounced off the level of 1.0936, where long positions should have been opened. The price subsequently rose to the level of 1.1011, from which it almost perfectly bounced off in terms of accuracy. At this point, longs should have been closed (profit was about 50 points), and perhaps even a short position opened. The only concern was the time it took to form this signal. If beginners worked it out, they would make a profit of 20 points. If not, the first trade still brought a decent profit.
How to trade on Wednesday:
On the hourly timeframe, the pair maintains a correctional trend. A correction remains a correction, so we expect its completion and the resumption of the downward trend. At the moment, we have an upward trend line, so the completion of the correctional trend can be determined by the price settling below it. On the 5-minute timeframe tomorrow, consider the levels 1.0568, 1.0611-1.0618, 1.0668, 1.0733, 1.0767-1.0781, 1.0835, 1.0896-1.0904, 1.0936, 1.0971-1.0981, 1.1011, 1.1043, and 1.1091. When passing 15 points in the right direction, you can set a breakeven point. Stop Loss. On Wednesday, a relatively important inflation report for November will be released in Germany and the USA - the third estimate of GDP for the third quarter. Theoretically, both of these reports can provoke a market reaction, but in practice, it may not occur at all, or it may be completely different from what traders expect.
Main Rules of the Trading System:
What's on the Charts:
Support and resistance levels - levels that serve as targets when opening buy or sell positions. Take Profit levels can be placed around them.
Red lines - channels or trendlines that reflect the current trend and show the preferred direction for trading.
MACD indicator (14, 22, 3) - histogram and signal line - an auxiliary indicator that can also be used as a source of signals.
Important speeches and reports (always included in the news calendar) can greatly influence the movement of the currency pair. Therefore, during their release, it is advisable to trade with maximum caution or exit the market to avoid a sharp reversal of the price against the previous movement.
For beginners trading in the forex market, it is essential to remember that not every trade can be profitable. Developing a clear strategy and money management are the keys to success in trading over the long term.
Díky analytickým přehledům společnosti InstaForex získáte plné povědomi o tržních trendech! Jako zákazníkovi společnosti InstaForex je Vám k dispozici velký počet bezplatných služeb umožňujících efektivní obchodování.

