 Zůstat
Obchodní podmínky
Nástroje


EUR/USD extended losses on Friday. Naturally, it wasn't surprising that the US dollar turned north after the pair had been falling for six consecutive days. The US released reports on unemployment and Nonfarm Payrolls, which traders were highly apprehensive about, remembering the previous disappointing reports. In addition, we saw the release of ADP and JOLTs reports, which also left much to be desired. Therefore, the tension before the release of US reports was off the charts.
In the end, both the unemployment rate and Nonfarm Payrolls turned out to be stronger than expected, prompting a new rise in the US currency. We have repeatedly mentioned that the American economy is in excellent condition, given the current level of the Federal Reserve's interest rate. Therefore, we expect the dollar to strengthen further. Perhaps next week, during the European Central Bank and FOMC meetings, the pair may experience a slight bullish correction, but it should resume its downward movement in the long run.
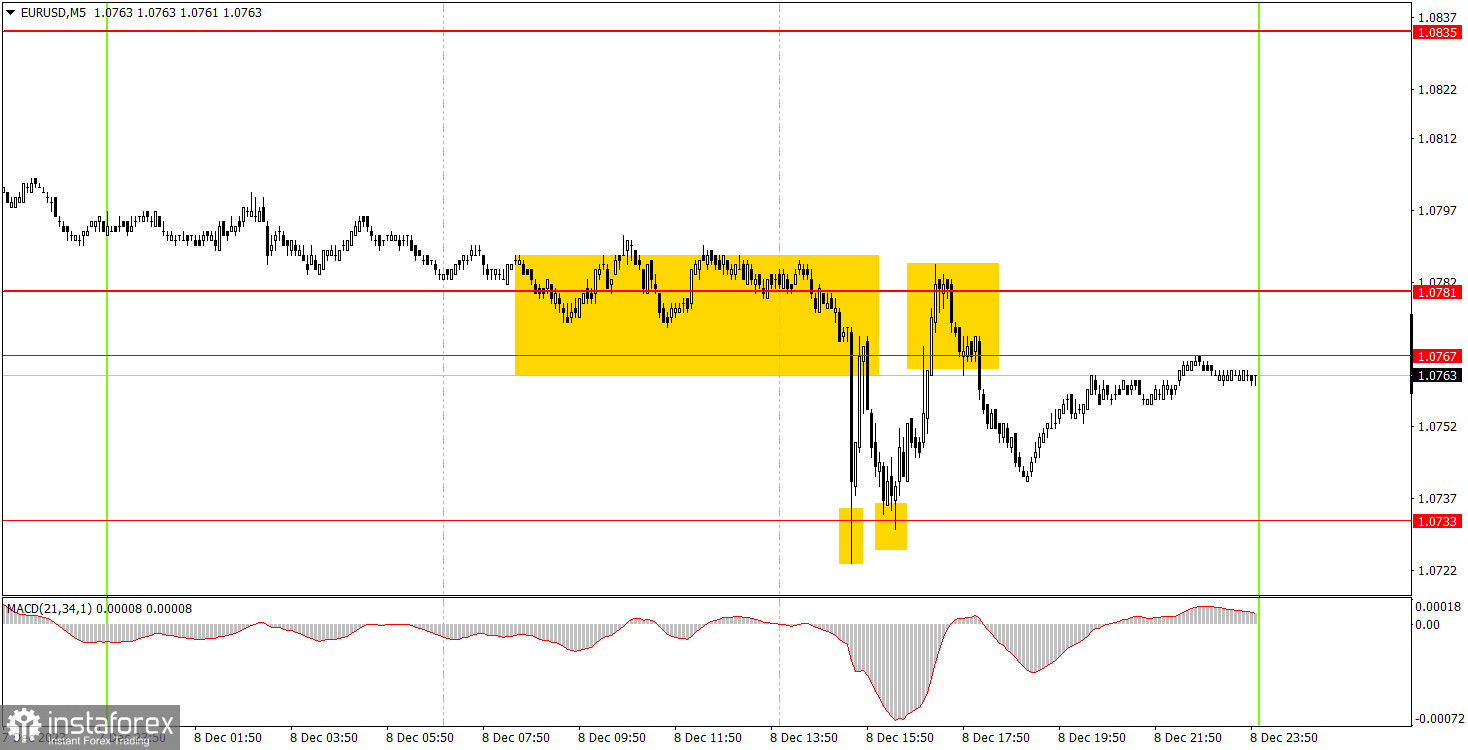
It doesn't make much sense to analyze the trading signals on the 5-minute chart. During the European session, we observed a flat market, and during the US session, a storm began. There was no opportunity to react to the US reports and enter the market. The pair formed four signals in literally half an hour. The levels were quite good, but, as mentioned, it was very difficult to enter the market in time. Only beginners could work out the last sell signal around the 1.0767-1.0781 area and make profit from it by several dozen pips.
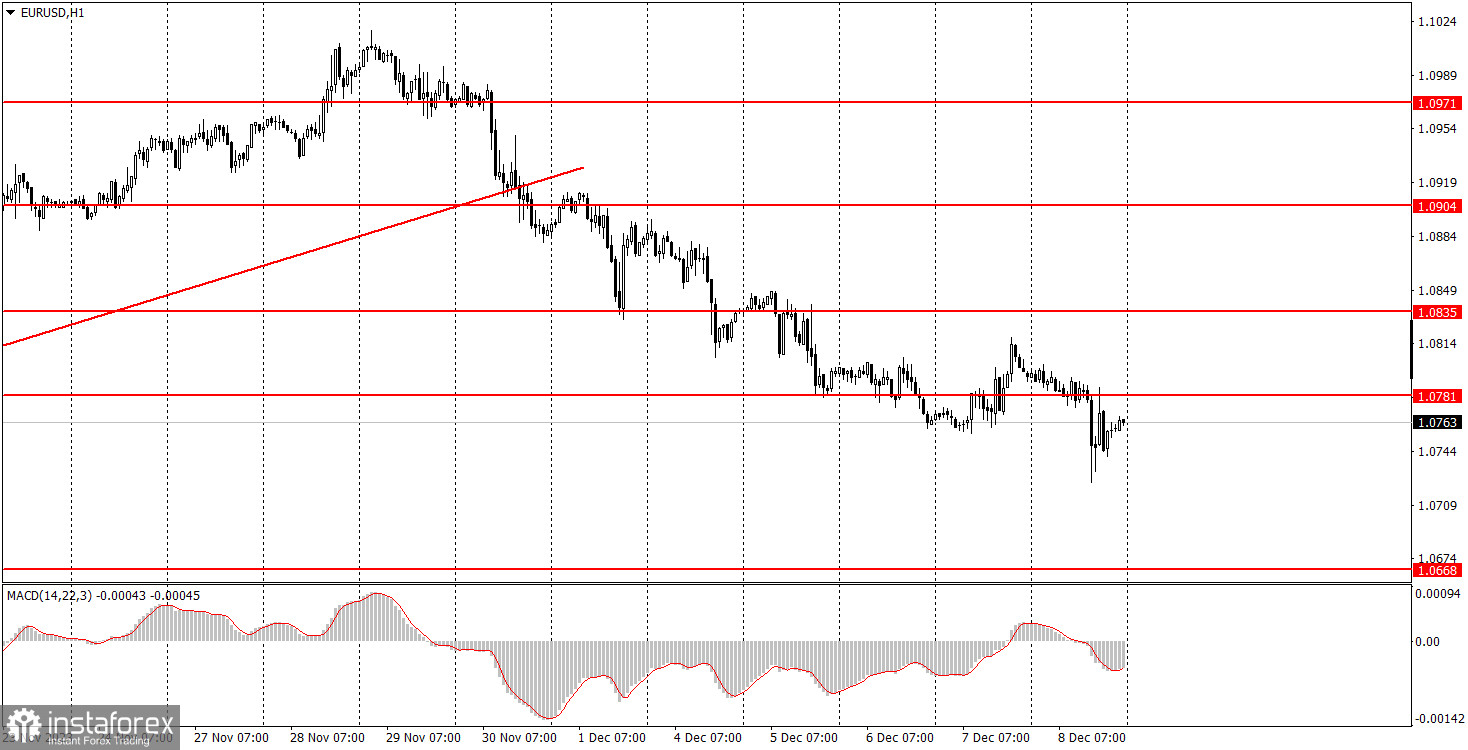
On the hourly chart, EUR/USD continues to form a new downtrend. The US reports did not spoil the picture for the dollar, but several events and reports are scheduled for the upcoming week. These can either boost or exert pressure on the US currency. However, overall, we expect the pair to fall to the 1.0200 level.
The key levels on the 5M chart are 1.0568, 1.0611-1.0618, 1.0668, 1.0733, 1.0767-1.0781, 1.0835, 1.0896-1.0904, 1.0940, 1.0971-1.0981, 1.1011, 1.1043, 1.1091. On Monday, there are no important events lined up in the US or the European Union. Therefore, it is quite likely that we will see another "boring Monday." There will be many crucial events during the week, so we might witness weak volatility on Monday.
1) Signal strength is determined by the time taken for its formation (either a bounce or level breach). A shorter formation time indicates a stronger signal.
2) If two or more trades around a certain level are initiated based on false signals, subsequent signals from that level should be disregarded.
3) In a flat market, any currency pair can produce multiple false signals or none at all. In any case, the flat trend is not the best condition for trading.
4) Trading activities are confined between the onset of the European session and mid-way through the U.S. session, post which all open trades should be manually closed.
5) On the 30-minute timeframe, trades based on MACD signals are only advisable amidst substantial volatility and an established trend, confirmed either by a trend line or trend channel.
6) If two levels lie closely together (ranging from 5 to 15 pips apart), they should be considered as a support or resistance zone.
Support and Resistance price levels can serve as targets when buying or selling. You can place Take Profit levels near them.
Red lines represent channels or trend lines, depicting the current market trend and indicating the preferable trading direction.
The MACD(14,22,3) indicator, encompassing both the histogram and signal line, acts as an auxiliary tool and can also be used as a signal source.
Significant speeches and reports (always noted in the news calendar) can profoundly influence the price dynamics. Hence, trading during their release calls for heightened caution. It may be reasonable to exit the market to prevent abrupt price reversals against the prevailing trend.
Beginning traders should always remember that not every trade will yield profit. Establishing a clear strategy coupled with sound money management is the cornerstone of sustained trading success.
Díky analytickým přehledům společnosti InstaForex získáte plné povědomi o tržních trendech! Jako zákazníkovi společnosti InstaForex je Vám k dispozici velký počet bezplatných služeb umožňujících efektivní obchodování.

