 Zůstat
Obchodní podmínky
Nástroje


EUR/USD continued its upward movement on Wednesday. In general, there is nothing more to say, because once again the euro rose when it should not have. Yesterday, the main upward movement occurred within one hour during the European trading session. What is interesting about this is that it did not happen during the release of the UK inflation report or the EU inflation report, but in between. Therefore, we cannot even call it a market reaction.
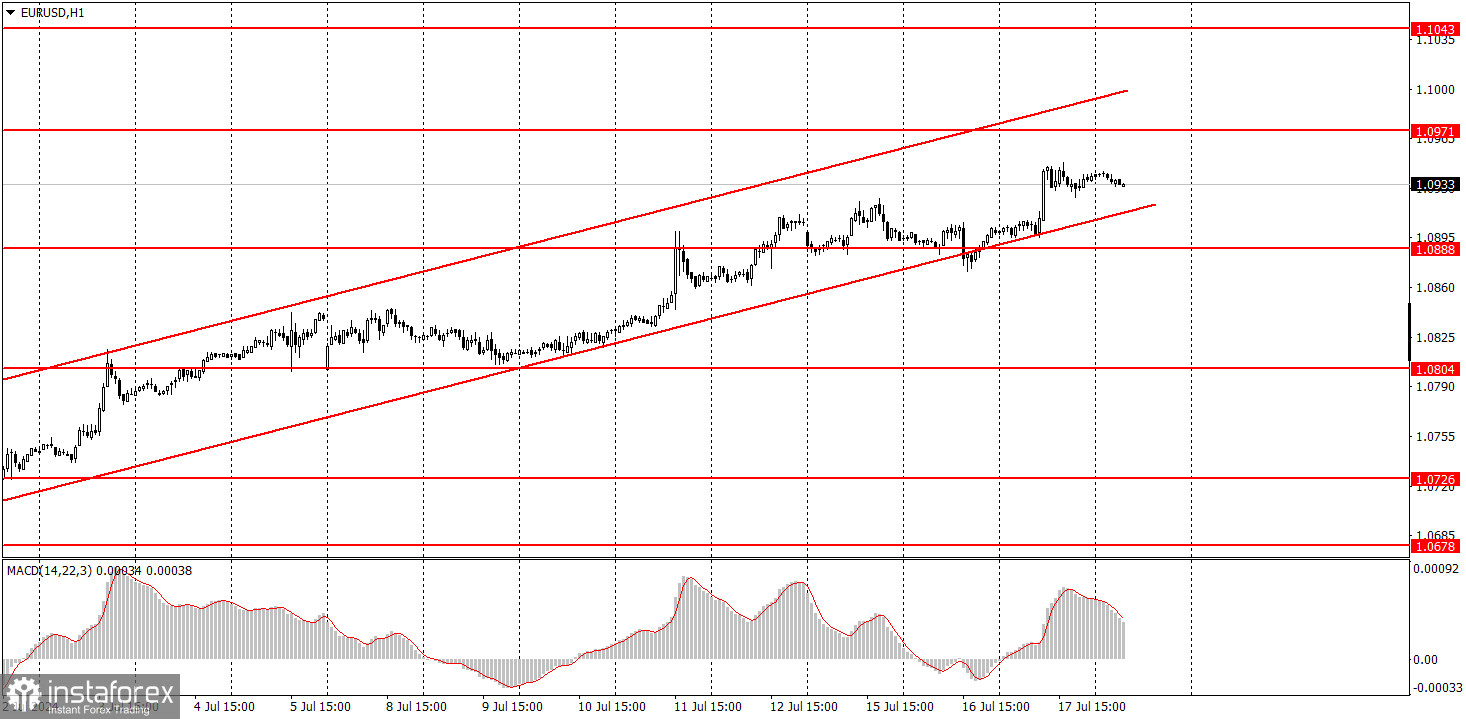
The second reading of the eurozone's inflation rate matched the initial estimate. Thus, there was no reason to buy the euro based on this report. Inflation in the UK held steady at 2%, which does not imply that the pound should rise, much less the euro, as the Bank of England is on the verge of lowering its rate. The upward trend remains intact, as shown by the channel. The pair continues to rise under any circumstances.
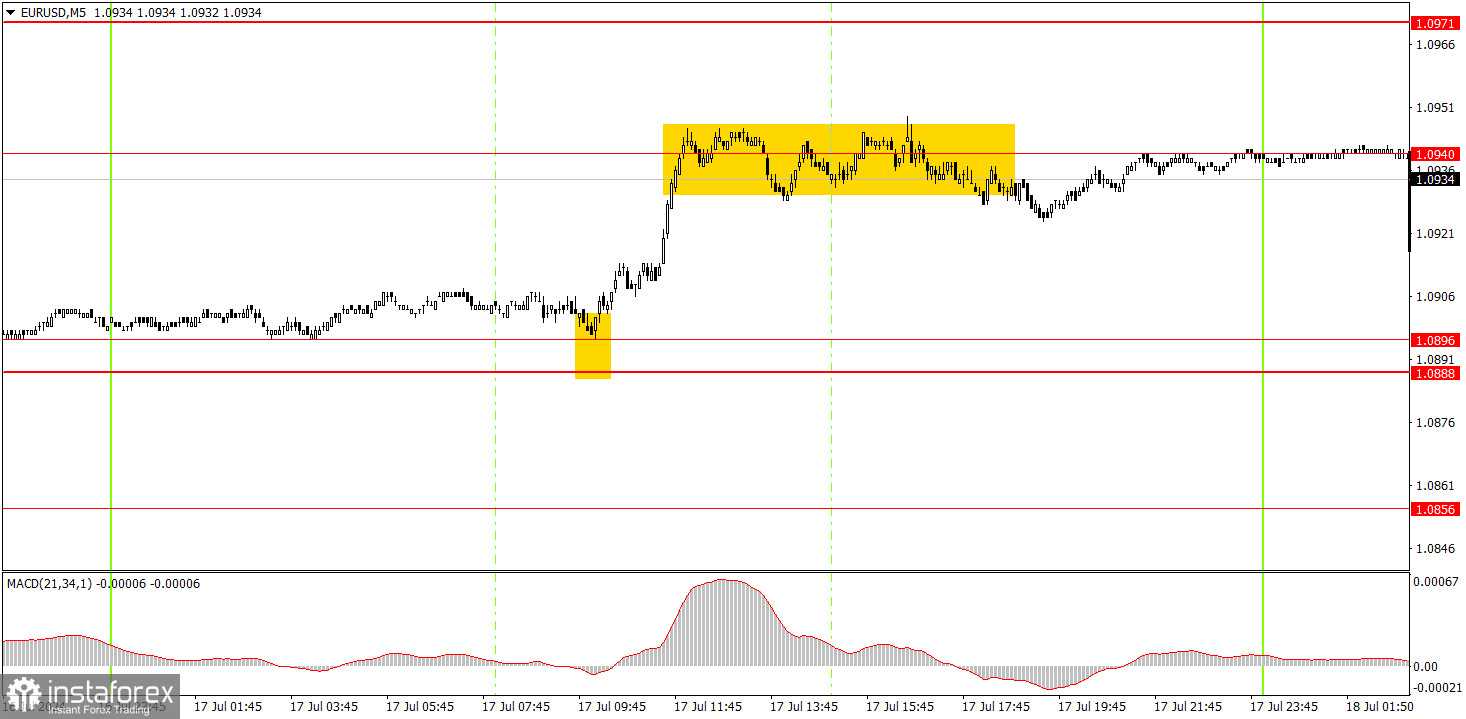
The pair formed a very good buy signal on the 5-minute timeframe. At the European trading session, the price reached the level of 1.0896, after which it managed to rise to the level of 1.0940. Therefore, novice traders could try to execute this buy signal. The price spent quite a lot of time around the level of 1.0940 and did not bounce from it nor overcome it. New signals should be expected today.
On the hourly chart, EUR/USD continues its local upward trend. Sometimes the market has a reason to buy the pair, and when it does not, it just comes up with a reason for itself. The single currency is firmly rising almost every day. The current movement seems illogical, but from a technical perspective, everything appears natural.
On Thursday, novice traders can trade from the level of 1.0940. The European Central Bank is scheduled to hold its meeting, which can provoke both an upward and downward movement. The fall is to a much lesser extent.
The key levels on the 5M chart are 1.0483, 1.0526,1.0568, 1.0611, 1.0678, 1.0726-1.0733, 1.0797-1.0804, 1.0838-1.0856, 1.0888-1, 0896, 1.0940, 1.0971-1.0981. The EU's economic calendar will feature the ECB meeting, and a speech of the ECB's President Christine Lagarde. The US will publish a few minor reports that are unlikely to attract investor interest.
1) Signal strength is determined by the time taken for its formation (either a bounce or level breach). A shorter formation time indicates a stronger signal.
2) If two or more trades around a certain level are initiated based on false signals, subsequent signals from that level should be disregarded.
3) In a flat market, any currency pair can produce multiple false signals or none at all. In any case, the flat trend is not the best condition for trading.
4) Trading activities are confined between the onset of the European session and mid-way through the U.S. session, after which all open trades should be manually closed.
5) On the 30-minute timeframe, trades based on MACD signals are only advisable amidst substantial volatility and an established trend, confirmed either by a trendline or trend channel.
6) If two levels lie closely together (ranging from 5 to 15 pips apart), they should be considered as a support or resistance zone.
Support and Resistance price levels can serve as targets when buying or selling. You can place Take Profit levels near them.
Red lines represent channels or trend lines, depicting the current market trend and indicating the preferable trading direction.
The MACD(14,22,3) indicator, encompassing both the histogram and signal line, acts as an auxiliary tool and can also be used as a signal source.
Significant speeches and reports (always noted in the news calendar) can profoundly influence the price dynamics. Hence, trading during their release calls for heightened caution. It may be reasonable to exit the market to prevent abrupt price reversals against the prevailing trend.
Beginners should always remember that not every trade will yield profit. Establishing a clear strategy coupled with sound money management is the cornerstone of sustained trading success.
Díky analytickým přehledům společnosti InstaForex získáte plné povědomi o tržních trendech! Jako zákazníkovi společnosti InstaForex je Vám k dispozici velký počet bezplatných služeb umožňujících efektivní obchodování.

