 Zůstat
Obchodní podmínky
Nástroje


Analýza čtvrtečních obchodů:
GBP/USD v grafu 1H
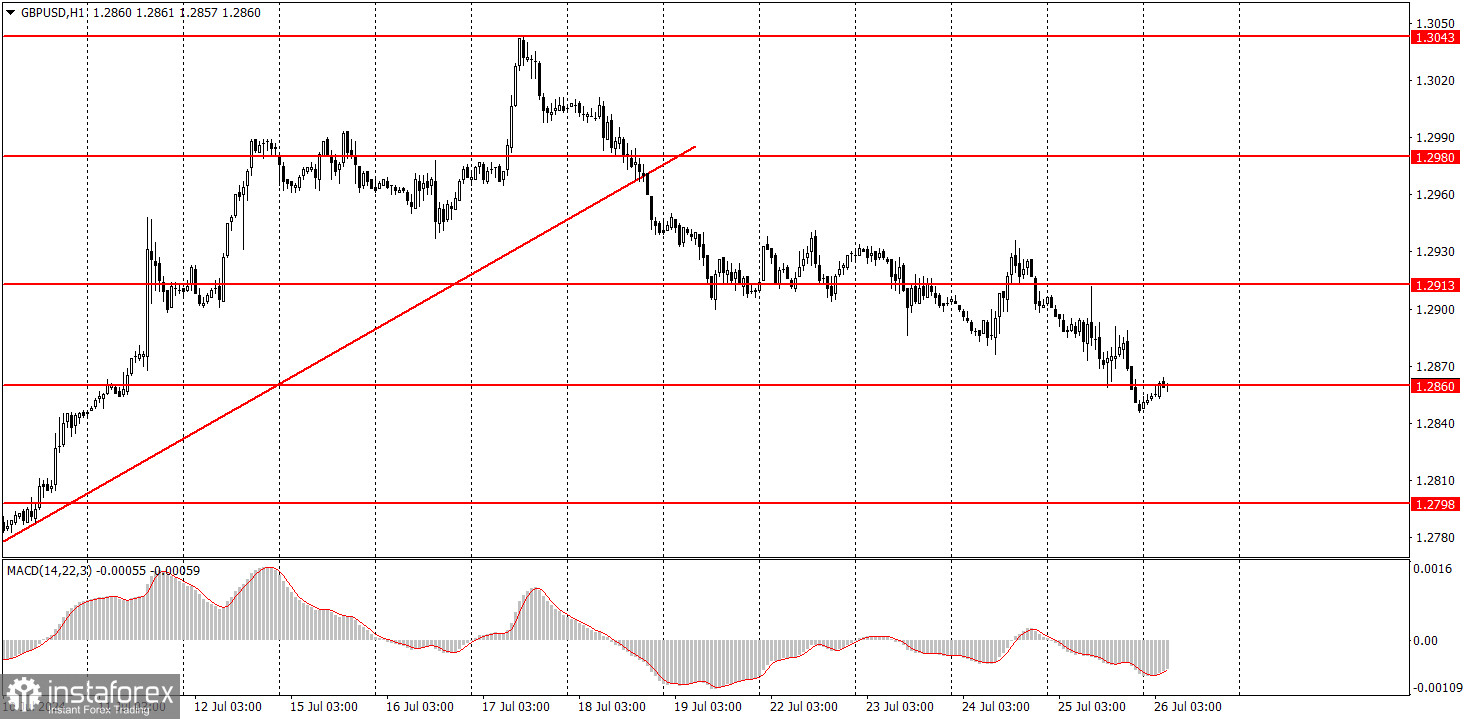
Pár GBP/USD ve čtvrtek dál pozvolna klesal. Dolar by měl posilovat bez ohledu na makroekonomické pozadí. Cena se v hodinovém grafu usadila pod vzestupnou trendovou linií; britská libra je překoupená a nepřiměřeně drahá. Už tři měsíce roste téměř bez korekcí a trh už několikrát zpracoval celé fundamentální pozadí ve prospěch libry. Včerejší zpráva o americkém HDP navíc ukázala výraznější růst, než se čekalo. Proto by podle nás měl americký dolar růst mnohem výrazněji, než aktuálně roste.
Trh bohužel s prodejem páru nespěchá. Problémem podle všeho není ani tak neochota trhu prodávat, jako spíš jeho celková neochota zapojovat se do jakýchkoli transakcí. Volatilita není jen nízká; je nízká a klesá ještě níž.
GBP/USD v grafu 5M
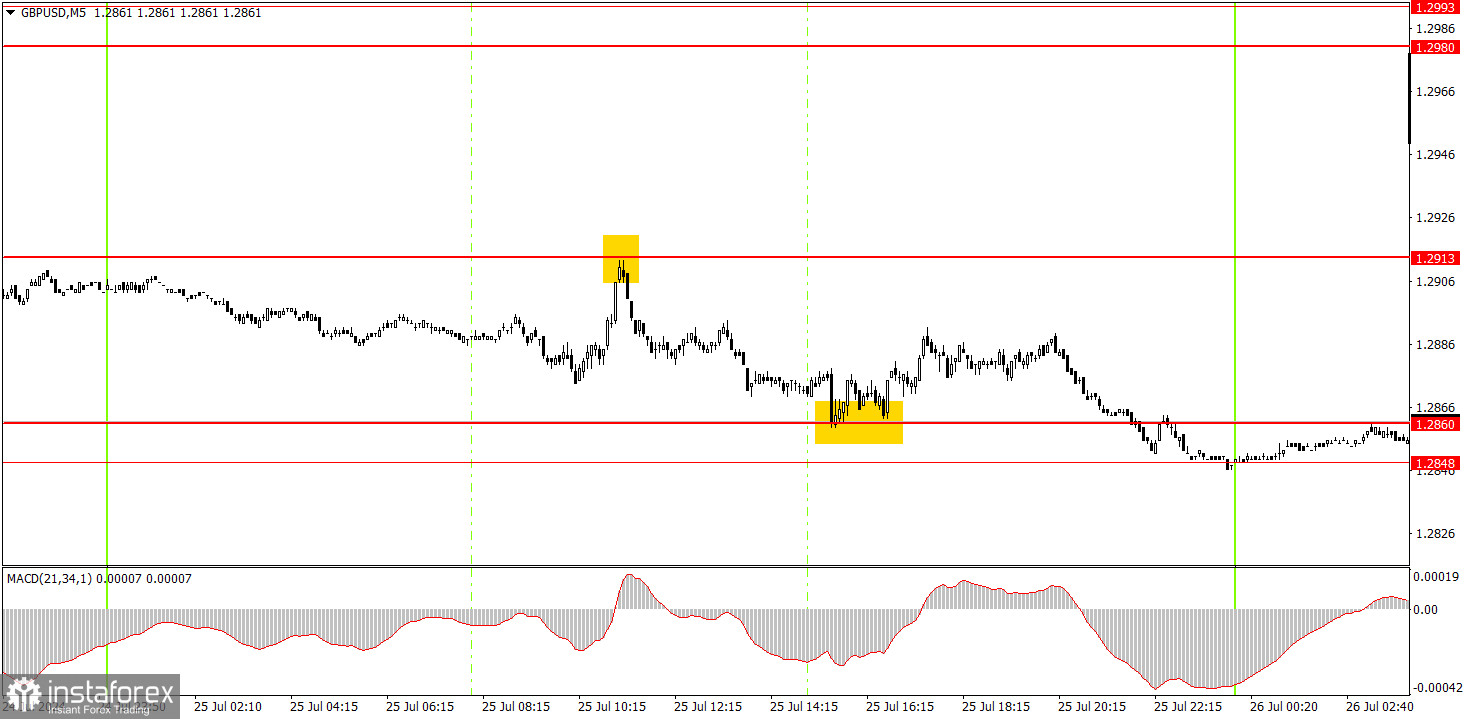
Britská libra vytvořila v časovém rámci 5M dva perfektní signály. Nejdřív se pár odrazil od úrovně 1,2913 a pak od úrovně 1,2860. První short pozice mohla přinést zisk zhruba 25 pipů a druhá pozice dalších deset pipů. Vzhledem k současné volatilitě a charakteru pohybů je tento zisk skvělý. Libra dál pomalu klesá.
Tipy na páteční obchodování:
Pár GBP/USD má v hodinovém časovém rámci konečně šanci na menší pokles. Překonal vzestupnou trendovou linii, takže bychom zaznamenat určitou korekci. V ideálním případě by libra měla klesnout alespoň o 400–500 pipů. Trh už několikrát zohlednil všechny faktory růstu, dolar je podhodnocený a Bank of England může v blízké době začít snižovat sazby. Britská měna má víc důvodů k poklesu než k růstu.
Začátečníci mohou v pátek obchodovat v pásmu 1,2848–1,2860. Pohyby páru zůstávají bohužel velmi slabé a mají častá období lokálních flatů.
Klíčové úrovně v časovém rámci 5M, které je třeba zvážit, jsou 1,2605–1,2633, 1,2684–1,2693, 1,2748, 1,2791–1,2798, 1,2848–1,2860, 1,2913, 1,2980–1,2993, 1,3043, 1,3102–1,3107, 1,3145. Spojené království dnes nemá naplánovány žádné významné události, zatímco USA zveřejní středně důležité zprávy o spotřebitelském sentimentu, osobních příjmech a výdajích a cenový index výdajů na osobní spotřebu. Tyto zprávy mohou ovlivnit tržní sentiment, ale pravděpodobně dnes neuvidíme pohyby o volatilitě nad 50 pipů...
Základní pravidla systému obchodování:
1) Síla signálu závisí na době, za kterou se vytvořil (odraz nebo průraz úrovně). Čím kratší doba, tím silnější signál.
2) Pokud byly po falešných signálech otevřeny poblíž určité úrovni minimálně dva obchody, pak by měly být všechny následné signály poblíž této úrovně ignorovány.
3) Na plochém trhu může jakýkoli měnový pár vygenerovat mnoho falešných signálů nebo také nevygenerovat žádné. Při prvních známkách plochého trhu je každopádně lepší obchody ukončit.
4) Obchody se otevírají v době mezi začátkem evropské seance a polovinou americké seance. Po této době musí být všechny obchody manuálně zavřeny.
5) V časovém rámci 1H sou obchody založené na signálech MACD vhodné jen při značné volatilitě a zřetelném trendu, který je potvrzen buď trendovou linií, nebo trendovým kanálem.
6) Pokud leží dvě úrovně těsně u sebe (v rozmezí 5 až 20 pipů), měly by být považovány za zónu supportu nebo rezistence.
7) Po pohybu o 15 pipů v zamýšleném směru by měl být na breakeven nastaven příkaz stop-loss.
Co ukazují grafy:
Úrovně supportu a rezistence mohou sloužit jako cíle nákupu nebo prodeje. Do jejich blízkosti lze umístit take profit.
Červené linie jsou kanály nebo trendové linie, které ukazují aktuální trend a preferovaný směr obchodování.
Indikátor MACD (14, 22, 3), který zahrnuje histogram i signální linii, funguje jako pomocný nástroj a může být použit i jako zdroj signálu.
Důležité projevy a zprávy (vždy zaznamenány v ekonomickém kalendáři) mohou významným způsobem ovlivnit pohyb měnového páru. Obchodování v době jejich zveřejnění proto vyžaduje zvýšenou opatrnost. Může být rozumné trh opustit a vyvarovat se tak náhlých cenových zvratů proti převládajícímu trendu.
Začátečníci by si měli vždy pamatovat, že každý obchod nemůže být ziskový. Základním kamenem trvalého obchodního úspěchu je stanovení jasné strategie spolu s rozumným řízením peněz.
Díky analytickým přehledům společnosti InstaForex získáte plné povědomi o tržních trendech! Jako zákazníkovi společnosti InstaForex je Vám k dispozici velký počet bezplatných služeb umožňujících efektivní obchodování.


