 Zůstat
Obchodní podmínky
Nástroje


The EUR/USD pair showed high volatility again on Monday. This time, the dollar's problem was complex. The greenback depreciated further, although it collapsed on Friday following the latest disappointing reports on the U.S. labor market and unemployment. However, over the weekend, information began to emerge that the Federal Reserve might not only cut the key rate several times in 2024 due to a high likelihood of a recession but also hold an emergency meeting in August to cut the rate by 0.5%. This information and the general panic in the markets exerted significant pressure on the dollar. In our opinion, panic is just panic, and nothing is logical or standard about it. For instance, the cryptocurrency market is recovering on Tuesday. Therefore, the U.S. dollar may also recover. Talks of a recession in the U.S. began last year, yet the American economy continues to grow at rates higher than those in the EU, the UK, and expert forecasts.
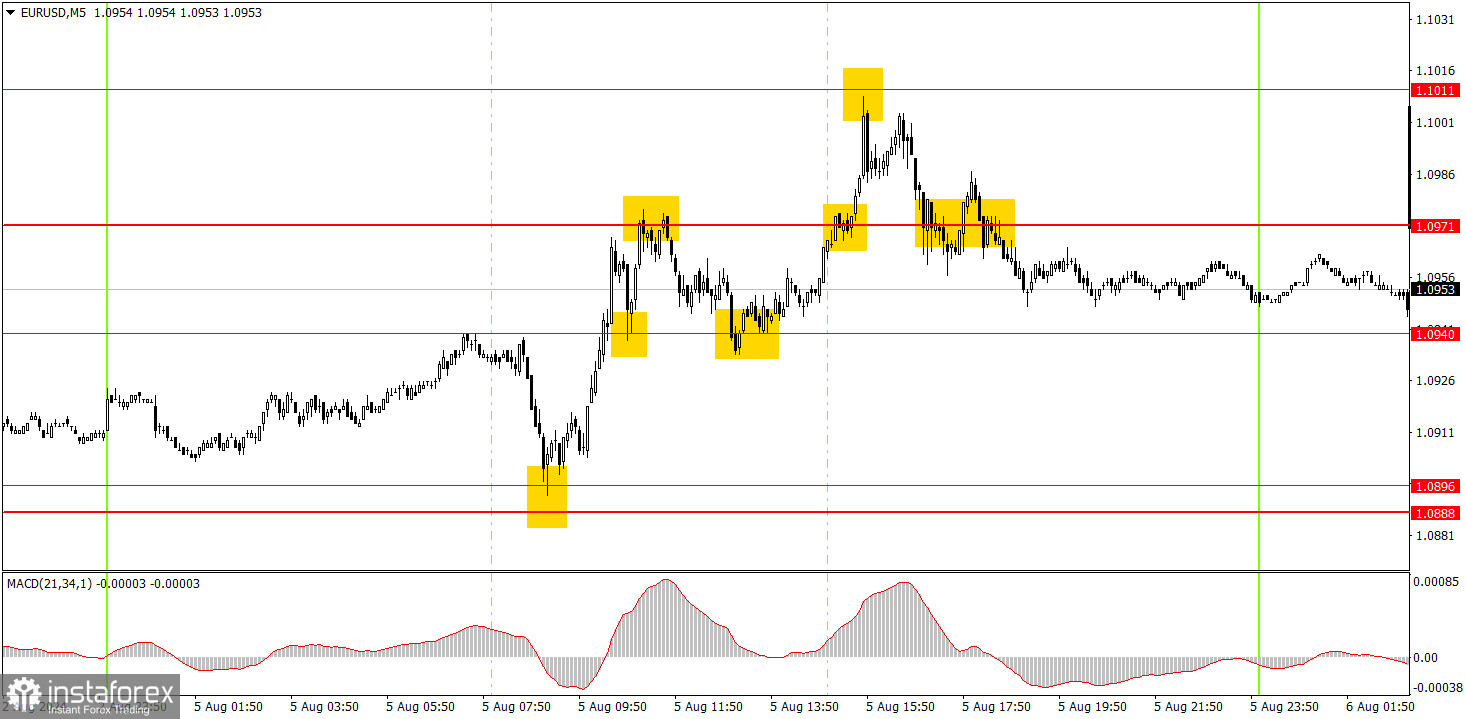
Many good signals were formed in the 5-minute time frame on Monday. It all started with a rebound from 1.0888-1.0896, after which the pair rose to 1.0971. Long position and profit. Rebound from the level of 1.0971 – short position, working off the nearest target and profit. Rebound from the 1.0940 – long position, working off 1.1011 and profit. Rebound from the level of 1.1011 – short position, working off the level of 1.0971 and profit. As we can see, as soon as the pair showed good volatility, good signals began to form in sufficient quantity.
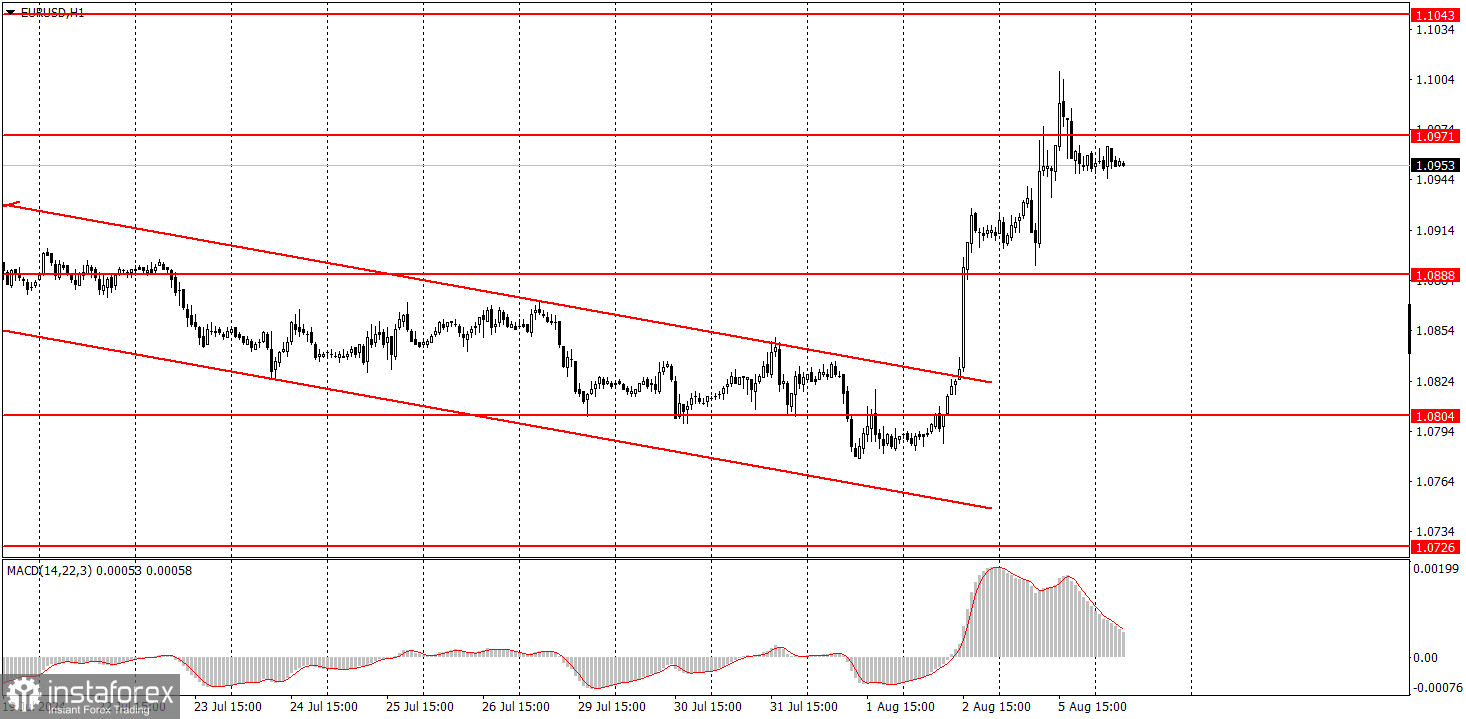
EUR/USD surged and broke the downward trend in the hourly time frame. We believe the euro has fully factored in all the bullish factors, so we do not expect the upward movement to continue. Yes, the U.S data let the dollar down again on Friday, but this does not mean the greenback will depreciate every day. The 24-hour timeframe continues to show a flat range between 1.06 and 1.10. There is no reason to leave this range yet. The market is now in a state of panic and chaos.
On Tuesday, beginners can trade from the nearest levels. The pair is currently showing good movements, with a sufficient number of signals forming. However, volatility may decrease, and a bearish correction has been brewing since Friday.
The key levels to consider on the 5M timeframe are 1.0526, 1.0568, 1.0611, 1.0678, 1.0726-1.0733, 1.0797-1.0804, 1.0838-1.0856, 1.0888-1.0896, 1.0940, 1.0971, 1.1011, 1.1043, 1.1091. The only scheduled report on Tuesday is retail sales in the EU. We still expect the U.S. dollar to recover.
1) The strength of a signal is determined by the time it took for the signal to form (bounce or level breakthrough). The shorter the time required, the stronger the signal.
2) If two or more trades around a certain level are initiated based on false signals, subsequent signals from that level should be ignored.
3) In a flat market, any currency pair can produce multiple false signals or none at all. In any case, it's better to stop trading at the first signs of a flat market.
4) Trades should be opened between the start of the European session and mid-way through the U.S. session. All trades must be closed manually after this period.
5) In the hourly time frame, trades based on MACD signals are only advisable amidst substantial volatility and an established trend, confirmed either by a trendline or trend channel.
6) If two levels are too close to each other (from 5 to 20 pips), they should be considered as a support or resistance zone.
7) After moving 15 pips in the intended direction, the Stop Loss should be set to break-even.
Support and Resistance price levels can serve as targets when buying or selling. You can place Take Profit levels near them.
Red lines represent channels or trend lines that depict the current trend and indicate the preferred trading direction.
The MACD (14,22,3) indicator, encompassing both the histogram and signal line, acts as an auxiliary tool and can also be used as a source of signals.
Important speeches and reports (always noted in the news calendar) can profoundly influence the price dynamics. Hence, trading during their release calls for heightened caution. It may be reasonable to exit the market to prevent abrupt price reversals against the prevailing trend.
Beginners should always remember that not every trade will yield profit. Establishing a clear strategy, coupled with effective money management, is key to long-term success in trading.
Díky analytickým přehledům společnosti InstaForex získáte plné povědomi o tržních trendech! Jako zákazníkovi společnosti InstaForex je Vám k dispozici velký počet bezplatných služeb umožňujících efektivní obchodování.


