 Zůstat
Obchodní podmínky
Nástroje


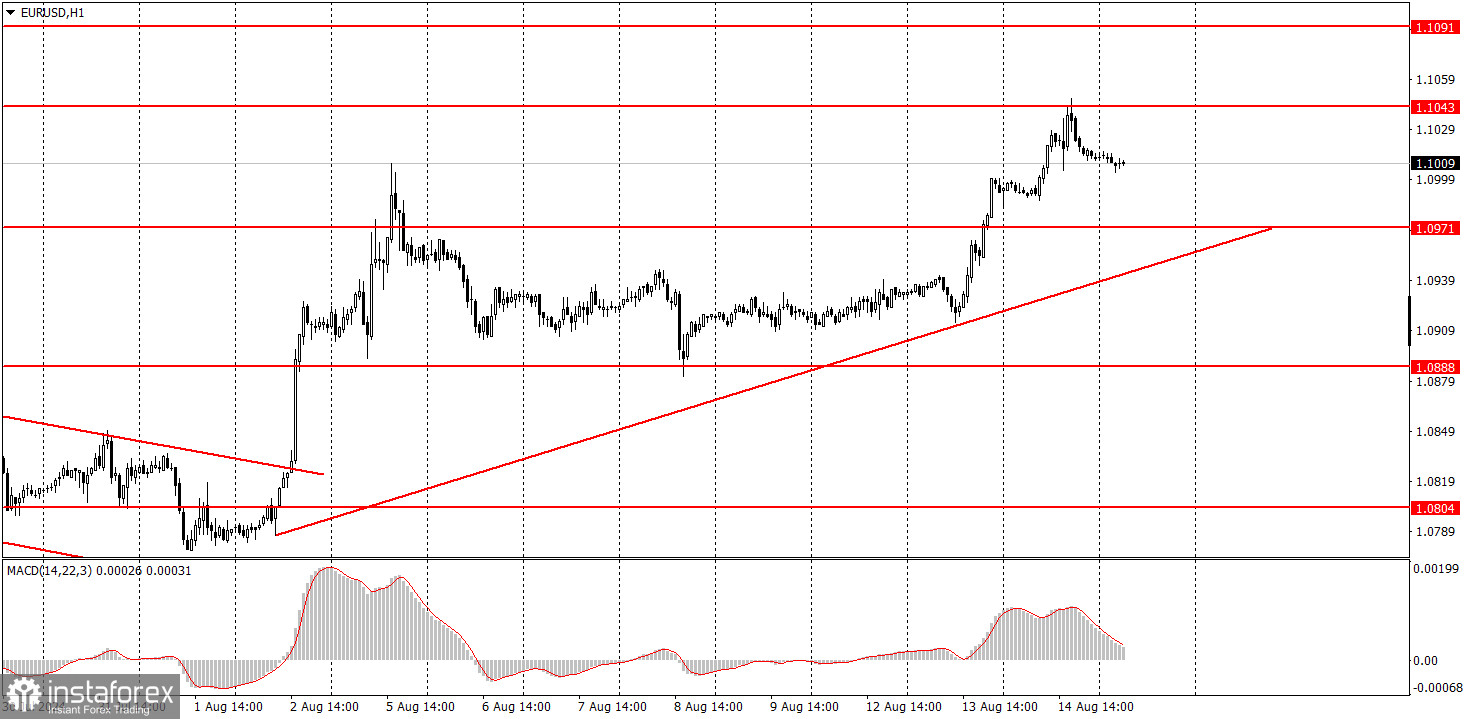
The EUR/USD pair continued to trade higher on Wednesday. This time, there was no need for specific reasons to support the sustained rise of the euro. If a day earlier, the market could buy the pair based on the U.S. Producer Price Index (which it successfully took advantage of), then on Wednesday morning, there was no reason to buy the euro. The Eurozone released a report for the second quarter of GDP and industrial production data, with the former matching the initial estimate and the latter falling short of forecasts. However, as is often the case, the market ignored the unfavorable data and reacted to the PPI, which showed a slowdown. In the afternoon, U.S. inflation data showed a 0.1% slowdown, more significant than anticipated. This provided a solid basis for the market to continue selling off the dollar. The upward movement only stopped around the 1.1043 level, but now we have a new, solid upward trend.
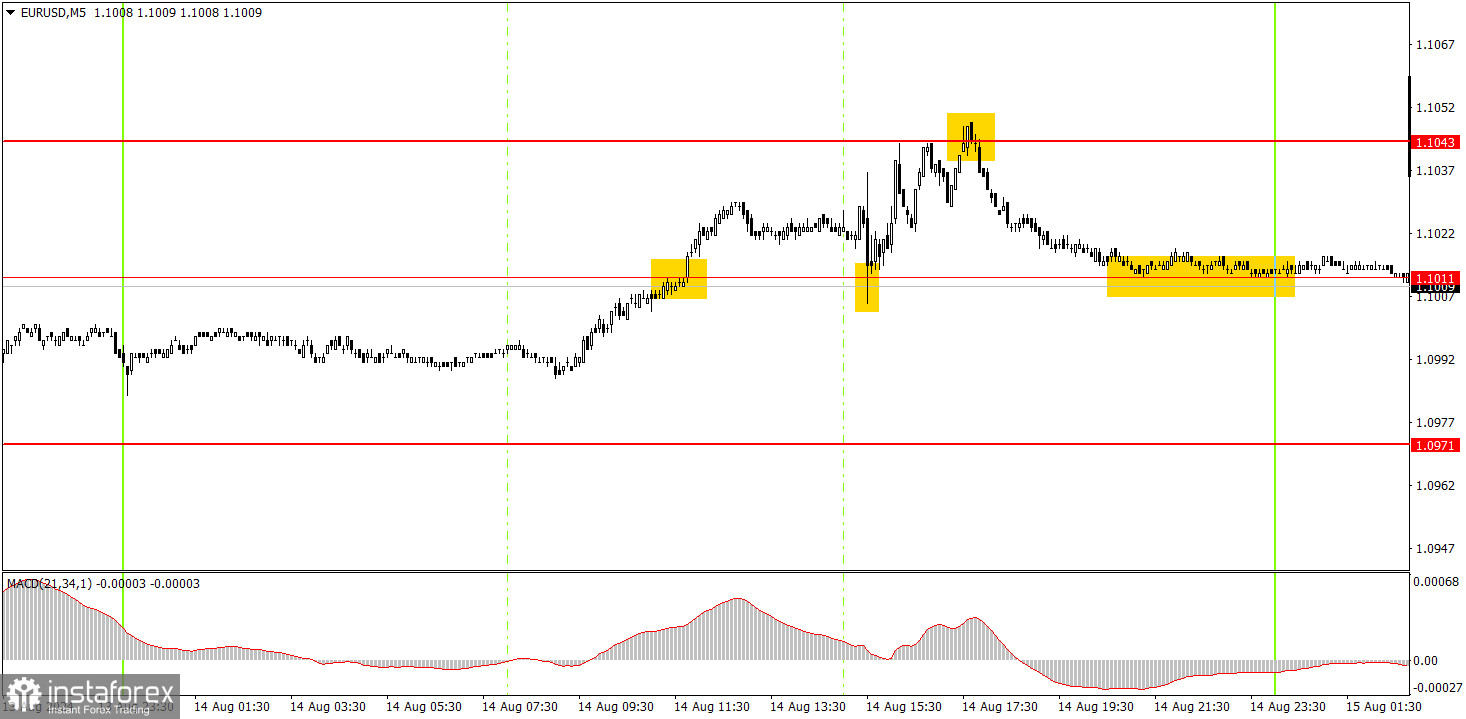
Three trading signals were generated on Wednesday in the 5-minute time frame. First, the pair breached the 1.1011 level, then bounced off it, subsequently reached the 1.1043 level, and bounced from there. Novice traders could have opened long positions around the 1.1011 level, closed them around 1.1043, opened short positions around that level, and then booked profits on shorts around 1.1011. The total profit amounted to 40 pips.
EUR/USD has formed a new upward trend supported by a trend line in the hourly time frame. We believe the euro has fully factored in all the bullish factors, so we do not expect sustained upward movement. The flat phase remains within the 1.06-1.10 range in the 24-hour time frame. However, the market again shows that it is ready to deal with any U.S. inflation slowdown by panic selling the dollar. Therefore, while expectations are one thing, the current technical picture should not be ignored. The pair can be expected to fall after consolidating below the trend line.
On Thursday, novice traders can expect a decline if the price consolidates below the 1.1011 level. In this case, the euro could drop to 1.0971.
The key levels to consider on the 5M time frame are 1.0526, 1.0568, 1.0611, 1.0678, 1.0726-1.0733, 1.0797-1.0804, 1.0838-1.0856, 1.0888-1.0896, 1.0940, 1.0971, 1.1011, 1.1043, 1.1091. On Thursday, there are no scheduled events or reports in the Eurozone, while in the U.S., less critical reports on industrial production, retail sales, and unemployment claims will be released.
1) The strength of a signal is determined by the time it took for the signal to form (bounce or level breakthrough). The shorter the time required, the stronger the signal.
2) If two or more trades around a certain level are initiated based on false signals, subsequent signals from that level should be ignored.
3) In a flat market, any currency pair can produce multiple false signals or none at all. In any case, it's better to stop trading at the first signs of a flat market.
4) Trades should be opened between the start of the European session and mid-way through the U.S. session. All trades must be closed manually after this period.
5) In the hourly time frame, trades based on MACD signals are only advisable amidst substantial volatility and an established trend, confirmed either by a trendline or trend channel.
6) If two levels are too close to each other (from 5 to 20 pips), they should be considered as a support or resistance zone.
7) After moving 15 pips in the intended direction, the Stop Loss should be set to break-even.
Support and Resistance price levels: targets when opening long or short positions. You can place Take Profit levels near them.
Red lines: channels or trend lines that depict the current trend and indicate the preferred trading direction.
The MACD (14,22,3) indicator, encompassing both the histogram and signal line, acts as an auxiliary tool and can also be used as a source of signals.
Important speeches and reports (always noted in the news calendar) can profoundly influence the price dynamics. Hence, trading during their release calls for heightened caution. It may be reasonable to exit the market to prevent abrupt price reversals against the prevailing trend.
Beginners should always remember that not every trade will yield profit. Establishing a clear strategy, coupled with effective money management, is key to long-term success in trading.
Díky analytickým přehledům společnosti InstaForex získáte plné povědomi o tržních trendech! Jako zákazníkovi společnosti InstaForex je Vám k dispozici velký počet bezplatných služeb umožňujících efektivní obchodování.

