 Zůstat
Obchodní podmínky
Nástroje


Stručná analýza:
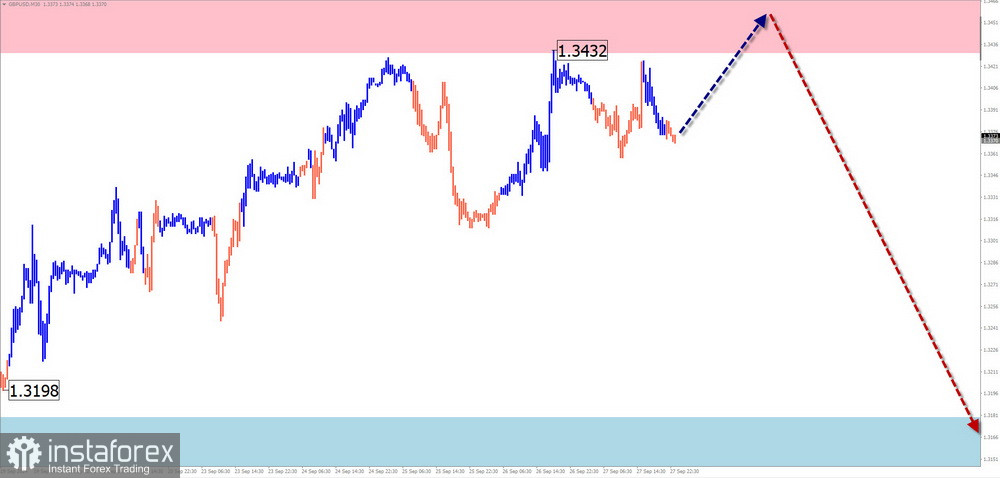
Pár GBP/USD v posledních dvou měsících formuje závěrečnou část (C) dominantního růstového trendu, který započal na podzim loňského roku. V denním časovém rámci se cena přiblížila k horní hranici potenciální zóny obratu. Současná vlnová struktura zatím nevypovídá o svém dokončení. K průlomu a pokračování poklesu potřebuje vlna získat dynamiku díky korekčnímu pohybu.
Týdenní předpověď:
V nadcházejících dnech očekáváme, že se současný růst britské libry plynule přesune do bočního trendu. Ve druhé polovině týdne pravděpodobně dojde k obratu a cena začne klesat. Zóna supportu označuje spodní hranici očekávaného týdenního rozpětí.
Potenciální úrovně obratu
Doporučení:
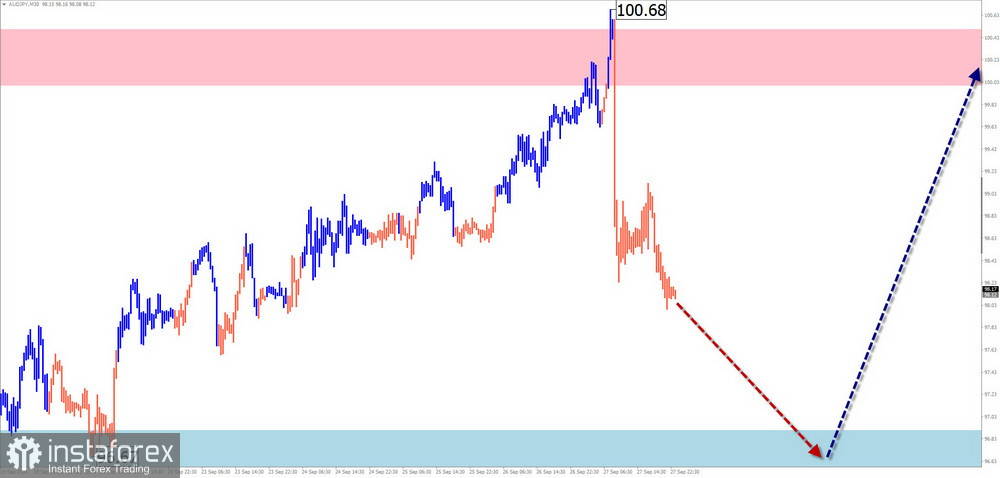
Stručná analýza:
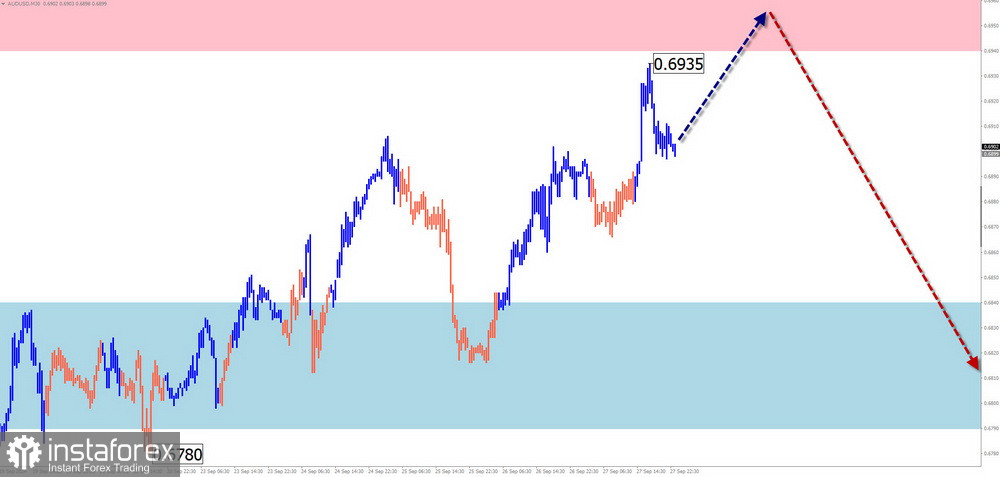
Směr krátkodobého trendu australského dolaru byl v posledních dvou měsících určován vzestupnou vlnou. Probíhající segment hlavního trendu začal 11. září. V denním grafu cena dosáhla silné úrovně rezistence a struktura vlny naznačuje, že jsou zde vhodné podmínky pro střednědobou korekci.
Týdenní předpověď:
V nadcházejících dnech očekávejte pokračování vzestupného pohybu, dokud cena nedosáhne zóny rezistence. Do konce týdne se očekává obrat a pokles ceny, která by mohla dosáhnout vypočtených úrovní supportu.
Potential Reversal Levels
Doporučení:
Stručná analýza:
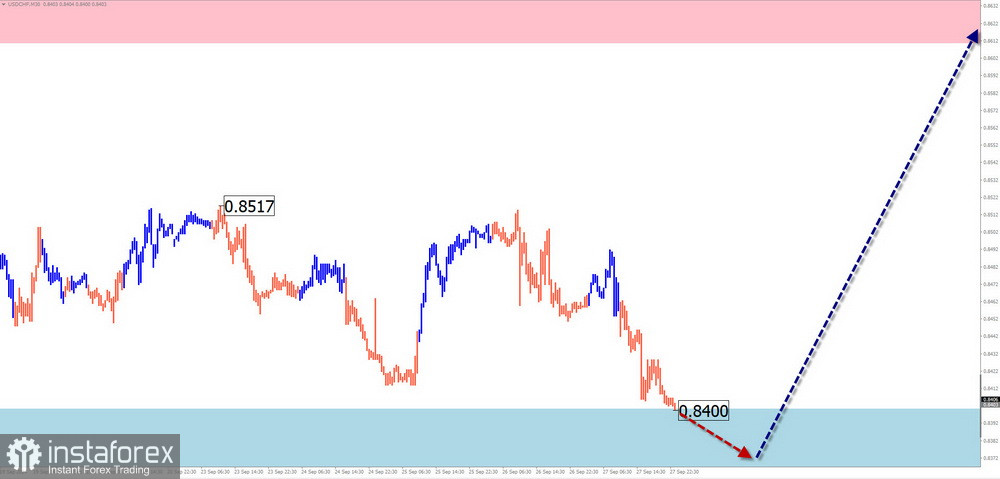
Rostoucí vlna měnového páru USD/CHF, která začala 5. srpna, má potenciál k obratu a pokud se potvrdí, určí nový směr krátkodobého trendu. Vlna se vyvíjí do strany a před pokračováním potřebuje získat dynamiku pomocí korekce.
Týdenní předpověď:
Na začátku týdne očekávejte, že se cena bude nadále pohybovat do strany podél zóny supportu. Blíže k víkendu se očekává obnovení růstu, přičemž cena pravděpodobně nevzroste výše než na úroveň vypočtené rezistence.
Potenciální úrovně obratu
Doporučení:
Stručná analýza:
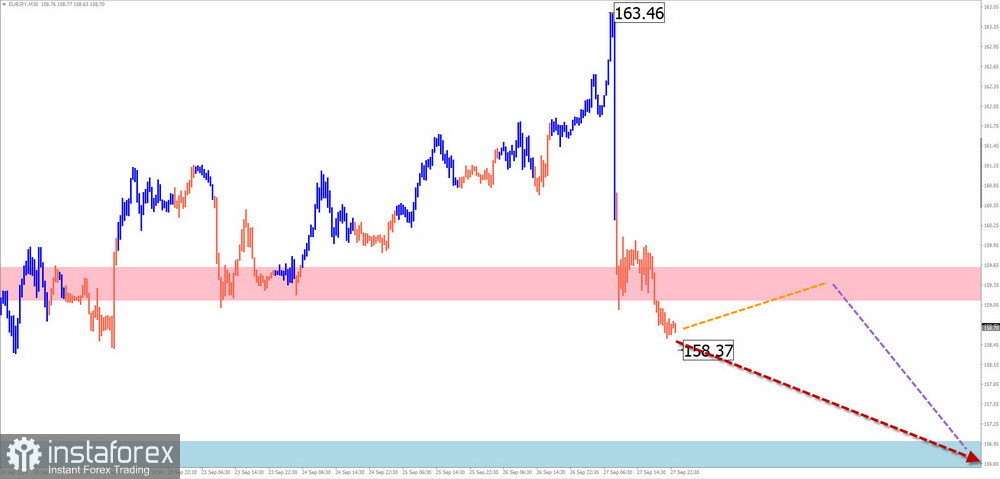
Měnový pár EUR/JPY se v týdenním časovém rámci poslední dva měsíce obchoduje v silné potenciální zóně obratu. Probíhající vzestupná vlna začala 16. září. Minulý týden se korekční část pohybu (B) vyvinula v boční formaci.
Týdenní předpověď:
V nadcházejících dnech očekávejte pohyb do strany podél úrovní rezistence. Ve druhé polovině týdne se pravděpodobně zvýší volatilita, po níž bude následovat obrat a obnovení aktivního poklesu cen, který možná vyvolá zveřejnění ekonomických údajů.
Potenciální zóny obratu
Doporučení:
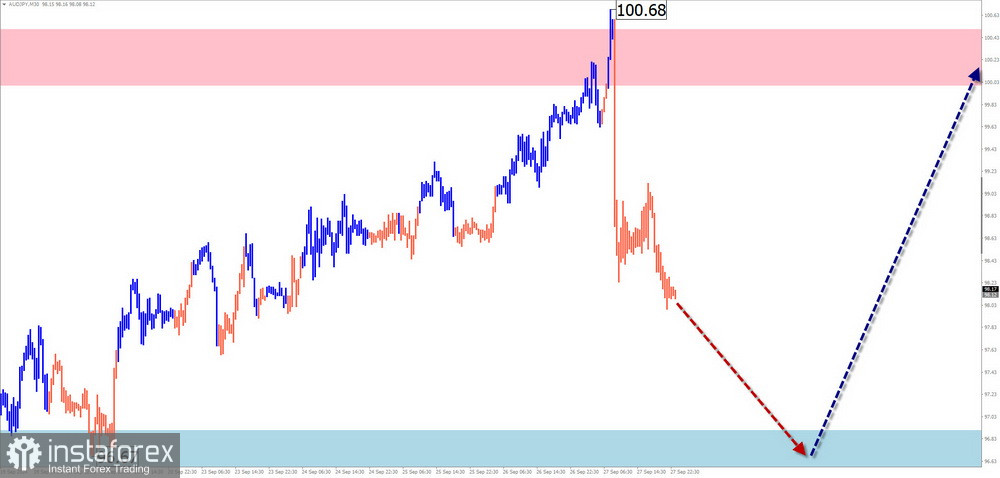
Přehled vývoje:
Od začátku srpna se měnový pár AUD/JPY pohybuje převážně do strany. Tento úsek vytváří ve větším měřítku grafu vzestupnou rovinu a analýza struktury naznačuje vytvoření střední části vlny (B).
Týdenní předpověď:
Na začátku týdne očekávejte klesající vektor, přičemž cena dosáhne vypočtené hranice supportu. V této zóně se mohou vytvořit podmínky pro obrat a do konce týdne je pravděpodobný opětovný růst kurzu tohoto páru.
Potenciální zóny obratu
Doporučení:
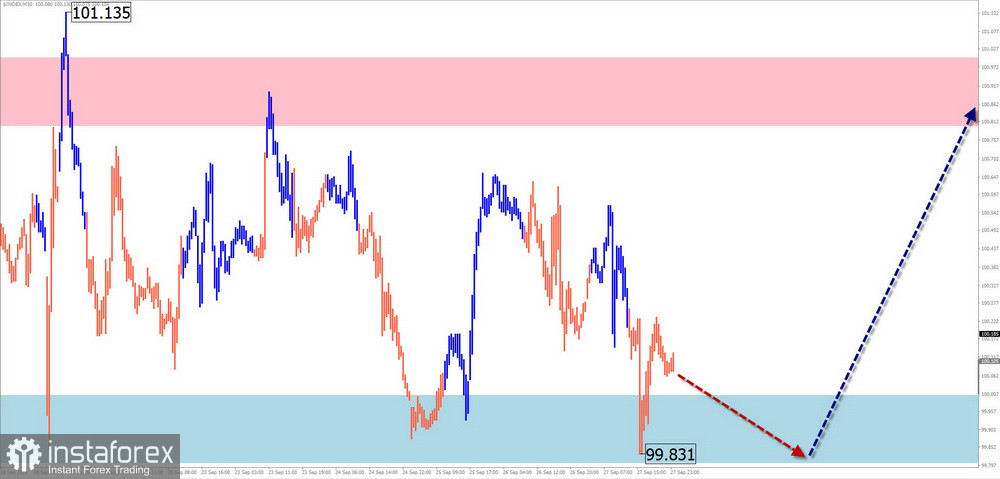
Přehled vývoje:
Klesající vlna, která začala v polovině června, určila nový směr krátkodobého trendu pro index amerického dolaru. Před dvěma týdny cena v týdenním časovém rámci dosáhla horní hranice silné zóny obratu. V současné době neexistují žádné signály pro blížící se obrat.
Týdenní předpověď:
Na začátku týdne očekávejte pokračování pohybu do strany podél zóny supportu s možným tlakem a krátkým proražením pod její spodní hranici. Obnovení vzestupného pohybu je pravděpodobnější směrem k víkendu.
Potenciální zóny obratu
Doporučení:
Sledování: Období slabosti amerického dolaru pokračuje, ale nebude trvat dlouho. Optimální je začít sledovat podmínky pro vstup do krátkých pozic vůči národním měnám na hlavních párech.
Analýza:
V grafu bitcoinu je směr trendu udáván algoritmem vzestupné vlny z letošního 8. srpna. Během uplynulého měsíce cena formovala závěrečnou část vlny (C), která zůstává nedokončená. Cena se blíží k silné rezistenci a v rámci závěrečného segmentu vlny je nutná přechodná korekce.
Týdenní předpověď:
V nadcházejícím týdnu očekávejte, že bitcoin bude pokračovat v růstu, dokud nedosáhne hranice rezistence. V následujících dnech se bude zvyšovat pravděpodobnost přechodu do bočního pohybu a zahájení poklesu ceny, přičemž zóna supportu bude omezovat rozsah poklesu.
Potenciální zóny obratu
Doporučení:
Poznámky: V rámci zjednodušené vlnové analýzy (SWA) se všechny vlny skládají ze 3 částí (A-B-C). V každém časovém rámci (TF) se analyzuje poslední nedokončená vlna. Tečkované čáry označují očekávané pohyby.
Pozor: Vlnový algoritmus nezohledňuje trvání pohybů instrumentu v čase!
Díky analytickým přehledům společnosti InstaForex získáte plné povědomi o tržních trendech! Jako zákazníkovi společnosti InstaForex je Vám k dispozici velký počet bezplatných služeb umožňujících efektivní obchodování.

