 Zůstat
Obchodní podmínky
Nástroje


Analýza pondělního obchodování:
Graf 1H pro pár EUR/USD:
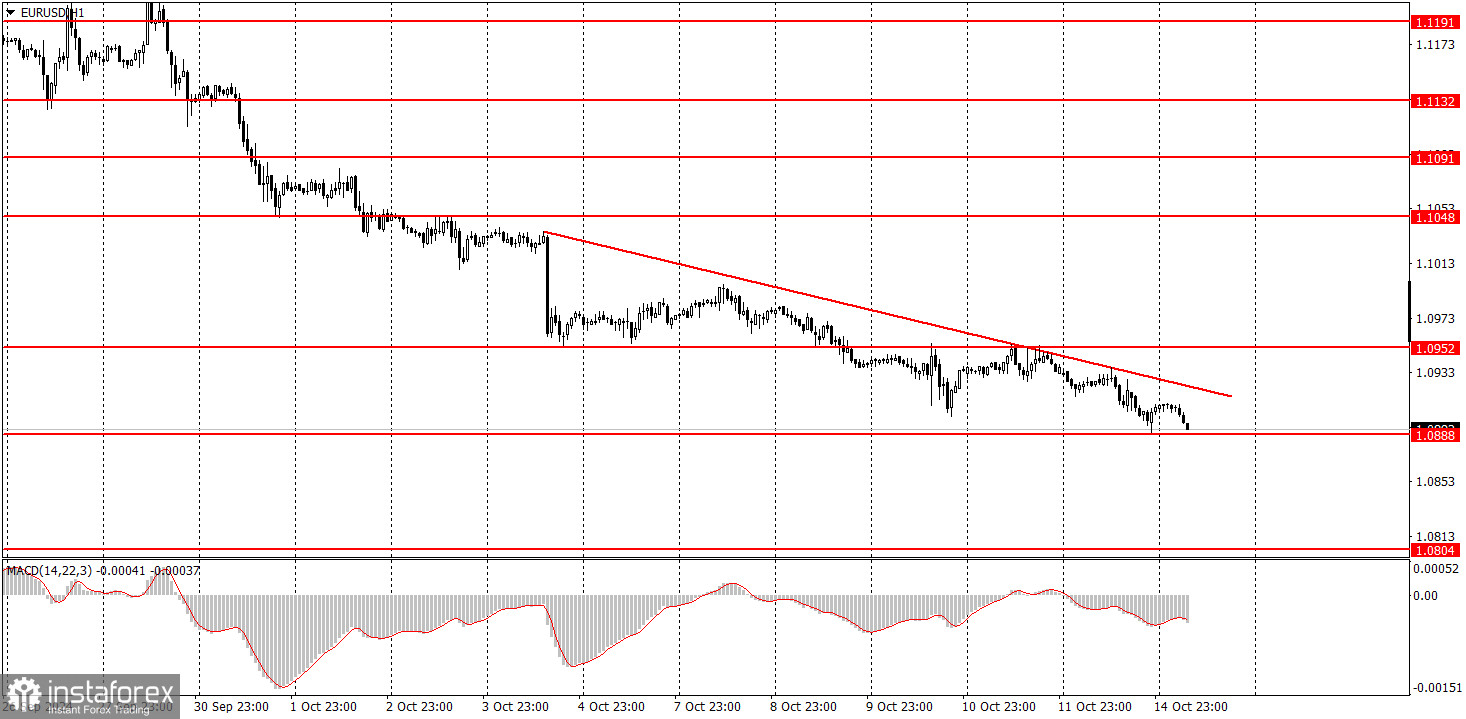
Pár EUR/USD v pondělí dál klesal. Pokles pokračoval až do úterní noci, ačkoli v EU ani USA nebyly žádné důležité zprávy ani události. Euro ale každý den klesá, a to pozvolna a s nízkou volatilitou, zato stabilně. Tento pohyb nás nepřekvapuje, protože už delší dobu poukazujeme na fakt, že euro bylo překoupené a bezdůvodně drahé. Trh už zohlednil celý cyklus uvolňování měnové politiky Federálního rezervního systému a teď, když tento cyklus začal, už není důvod k prodeji dolaru. Navíc trh podle všeho úplně zapomněl, že i ECB snižuje sazby a tento týden by je mohla snížit už potřetí. Podle nás by měl pár ve střednědobém horizontu dál klesat.
Graf 5M pro pár EUR/USD:
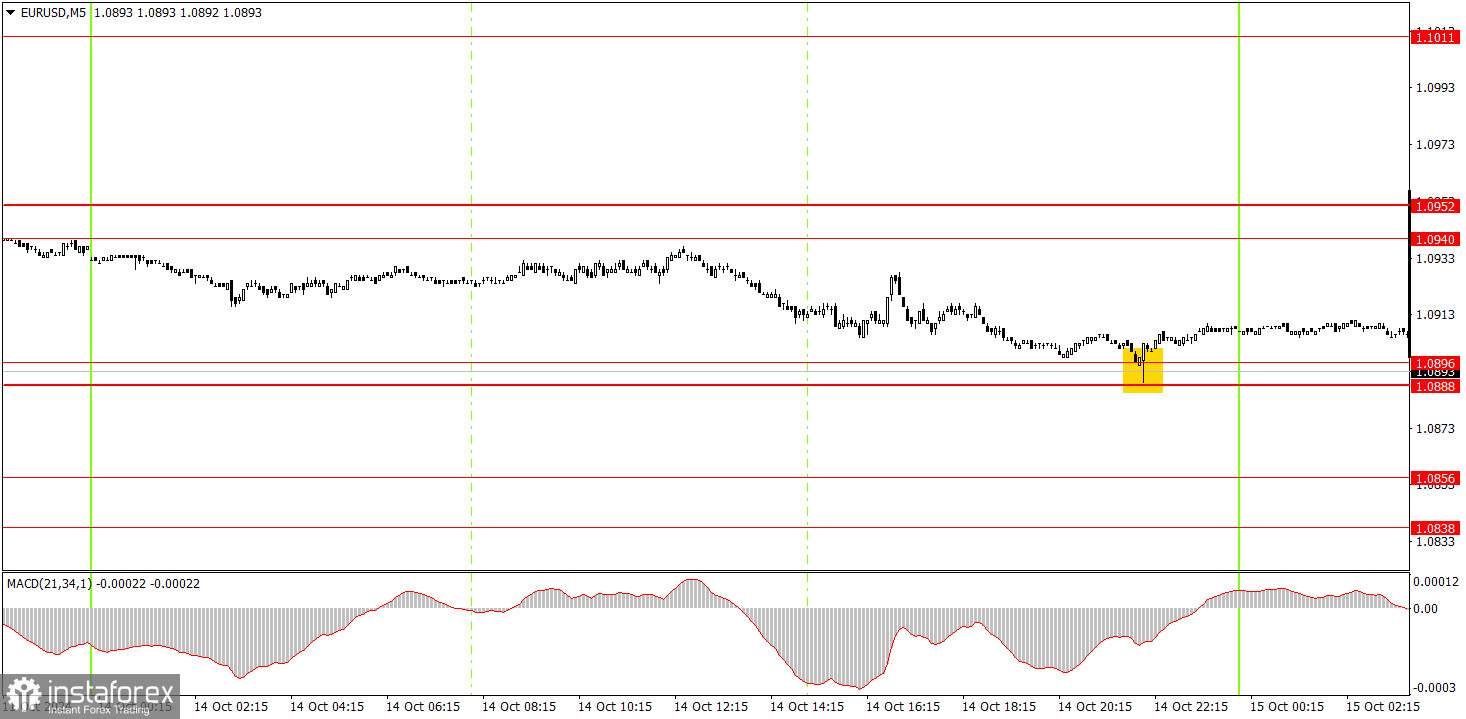
Pár v pondělí večer v časovém rámci 5M vygeneroval jeden nerelevantní signál k nákupu. V pátek cena dvakrát otestovala úroveň 1,0940–1,0951, ale v pondělí to nedokázala, takže nevytvořila žádné signály k prodeji. Nemáme příliš zájem o signály k nákupu během denních poklesů, protože není důvod nakupovat, když většina prodává.
Jak v úterý obchodovat:
Pár EUR/USD v grafu 1H výrazně postoupil k vytvoření nového downtrendu.Ve střednědobém horizontu by bohužel mohl pokračovat nečekaný prodej dolaru, protože nikdo neví, jak dlouho bude trh reagovat na uvolňování měnové politiky Fedu. Zatím je ale v grafu 1H zřetelný downtrend. Očekáváme, že euro bude dál klesat i bez korekce, protože je stále silně překoupené. Korekce by ale byla esteticky příjemnější.
V úterý by se mohlo obchodovat od úrovně 1,0888–1,0896. Opět očekáváme slabší pohyby, takže nikoli vysoké zisky.
V časovém rámci 5M vezměte v úvahu tyto klíčové úrovně: 1,0726–1,0733, 1,0797–1,0804, 1,0838–1,0856, 1,0888–1,0896, 1,0940–1,0951, 1,1011, 1,1048, 1,1091, 1,1132–1,1140, 1,1189–1,1191. V úterý bude zveřejněna zpráva o průmyslové produkci v EU, která nejspíš významně neovlivní chuť trhu aktivně obchodovat.
Základní pravidla systému obchodování:
1) Síla signálu: Síla signálu závisí na době, za kterou se vytvořil (odraz nebo průraz úrovně). Čím kratší doba, tím silnější signál.
2) Falešné signály: Pokud byly po falešných signálech otevřeny poblíž určité úrovni minimálně dva obchody, pak by měly být všechny následné signály poblíž této úrovně ignorovány.
3) Plochý trh: Na plochém trhu může jakýkoli měnový pár vygenerovat mnoho falešných signálů nebo také nevygenerovat žádné. Při prvních známkách plochého trhu je každopádně lepší obchody ukončit.
4) Časový rámec: Obchody se otevírají v době mezi začátkem evropské seance a polovinou americké seance. Po této době musí být všechny obchody manuálně zavřeny.
5) Signály z indikátoru MACD: V časovém rámci 1H jsou obchody založené na signálech MACD vhodné jen při značné volatilitě a zřetelném trendu, který je potvrzen buď trendovou linií, nebo trendovým kanálem.
6) Zavírací úrovně: Pokud leží dvě úrovně těsně u sebe (v rozmezí 5 až 20 pipů), měly by být považovány za zónu supportu nebo rezistence.
7) Stop-loss: Po pohybu o 15 pipů v zamýšleném směru by měl být nastaven stop-loss na breakeven.
Co je v grafech:
Důležité projevy a zprávy (vždy zaznamenány v ekonomickém kalendáři) mohou významným způsobem ovlivnit pohyb měnového páru. Obchodování v době jejich zveřejnění proto vyžaduje zvýšenou opatrnost. Může být rozumné trh opustit a vyvarovat se tak náhlých cenových zvratů proti převládajícímu trendu.
Začátečníci by si měli vždy pamatovat, že každý obchod nemůže být ziskový. Základem dlouhodobého obchodního úspěchu je stanovení jasné strategie spolu s rozumným řízením peněz.
Díky analytickým přehledům společnosti InstaForex získáte plné povědomi o tržních trendech! Jako zákazníkovi společnosti InstaForex je Vám k dispozici velký počet bezplatných služeb umožňujících efektivní obchodování.

