 Zůstat
Obchodní podmínky
Nástroje


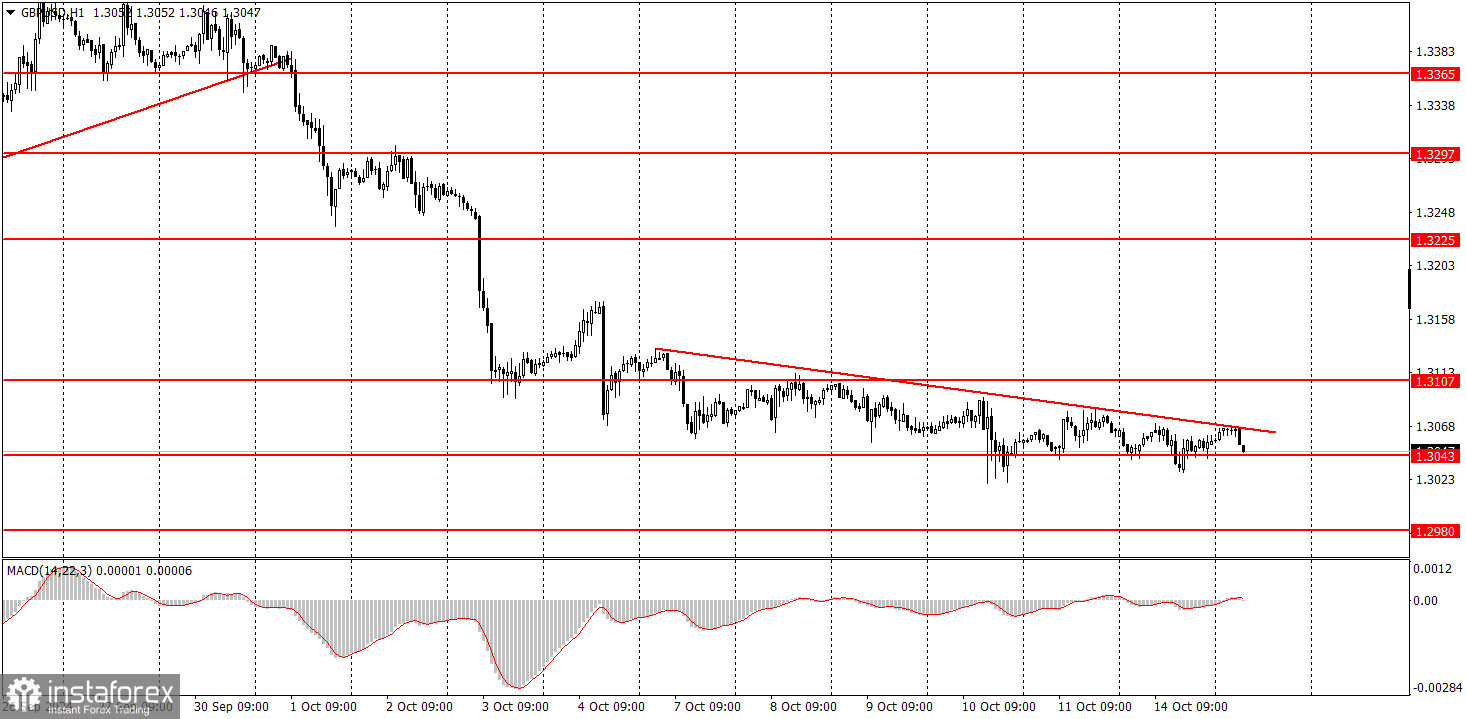
Pár GBP/USD se v pondělí vydal směrem k poklesu, ale v podstatě máme co do činění s flat trhem. Ano, cena se pomalu pohybuje směrem dolů, ale volatilita je minimální a pohyb je velmi nepravidelný. Proto je obchodování tohoto pohybu v rámci dne velmi obtížné a možná se ani nevyplatí. Nicméně britská libra pokračuje v poklesu, ačkoli například včera nybyly zveřejněny žádné makroekonomické zprávy ani se nekonaly žádné fundamentální události. I kdyby cena prorazila nad podmíněnou trendovou linii, nebude to mnoho znamenat. Všichni už dva týdny čekají korekci. Prolomení trendové linie při téměř flat pohybu však nebude znamenat, že libra provede korekci o 100–200 bodů. Ve střednědobém horizontu stále očekáváme, že pár bude pokračovat v poklesu. Mějte na paměti zprávu o inflaci ve Velké Británii, která bude zveřejněna tento týden.
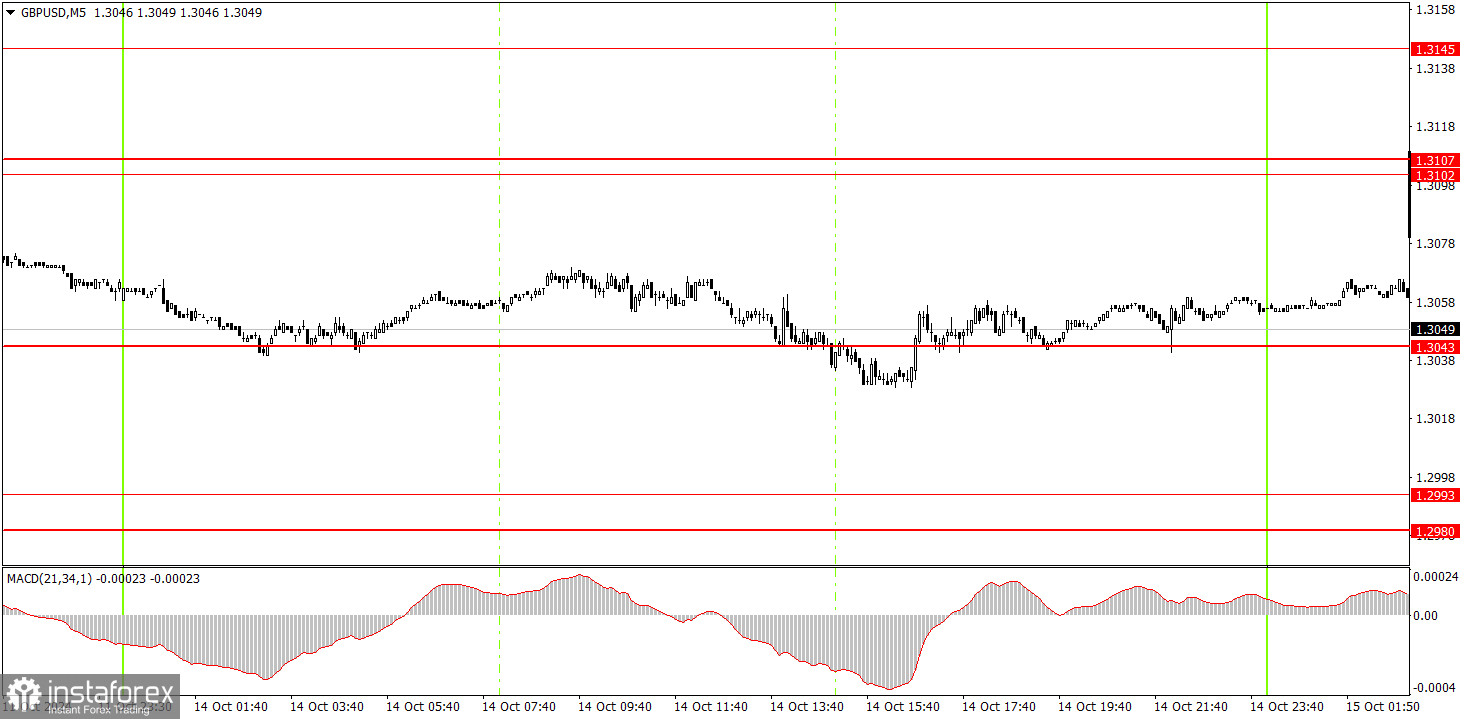
V 5minutovém časovém rámci se v pondělí vytvořilo několik obchodních signálů, ale nebyl důvod na ně reagovat. Z 5minutového grafu jasně vyplývá, že se cena během dne pohybovala do strany. V rámci flat trhu úrovně, trendové linie a další technické signály/indikátory nefungují.
V hodinovém časovém rámci pár GBP/USD prorazil uptrend a pokračuje v poklesu. Americký dolar obnovil svůj vzestupný trend, ale při prodeji se doporučuje být opatrný, protože pár se za poslední dva týdny ani nepokusil o korekci. Nicméně v současné době není reálný důvod očekávat korekci. Ve střednědobém horizontu očekáváme, že pár bude pokračovat v poklesu, protože se domníváme, že je to jediná logická možnost.
V úterý se opět neočekává nic jiného než flat pohyb. Upozorňujeme začínající obchodníky, že prolomení trendových linií nebo úrovní během flat trhu vyvolává extrémně slabé signály. A v současné době také zažíváme velmi nízkou volatilitu.
V 5minutovém časovém rámci můžete obchodovat od úrovní 1,2913, 1,2980–1,2993, 1,3043, 1,3102–1,3107, 1,3145–1,3167, 1,3225, 1,3272, 1,3365, 1,3428–1,3440, 1,3488 a 1,3537. V úterý bude ve Velké Británii zveřejněna zpráva o mzdách a nezaměstnanosti. Jedná se o poněkud zajímavé zprávy, ale slabý klesající trend bude spolu s nízkou volatilitou pravděpodobně pokračovat. Ve středu by mohla trhem trochu otřást zpráva o inflaci ze Spojeného království.
1) Síla signálu závisí na době, za kterou se vytvořil (odraz od úrovně nebo její proražení). Kratší doba formace znamená silnější signál.
2) Pokud byly po falešných signálech otevřeny na určité úrovni minimálně dva obchody, pak by měly být všechny následné signály poblíž této úrovně ignorovány.
3) Na flat trhu může jakýkoli měnový pár vygenerovat mnoho falešných signálů nebo také nevygenerovat žádné. Flat trend každopádně nenabízí nejlepší podmínky pro obchodování.
4) Obchody se otevírají v době mezi začátkem evropské seance a polovinou americké seance, kdy by měly být všechny obchody manuálně uzavřeny.
5) V hodinovém časovém rámci jsou obchody založené na signálech MACD vhodné jen při značné volatilitě a zřetelném trendu, který je potvrzen buď trendovou linií, nebo trendovým kanálem.
6) Pokud leží dvě úrovně těsně u sebe (v rozmezí 5 až 20 bodů), měly by být považovány za oblast supportu nebo rezistence.
7) Po posunu o 20 bodů v zamýšleném směru je potřeba nastavit stop loss na úroveň break-even.
Důležité projevy a zprávy (vždy zaznamenány v ekonomickém kalendáři) mohou významným způsobem ovlivnit pohyb měnového páru. Obchodování v době jejich zveřejnění proto vyžaduje zvýšenou opatrnost. Může být rozumné trh opustit a vyvarovat se tak náhlých cenových obratů proti převládajícímu trendu.
Začátečníci by si měli vždy pamatovat, že každý obchod nemůže být ziskový. Základním kamenem trvalého obchodního úspěchu je stanovení jasné strategie spolu s rozumným řízením peněz.
Díky analytickým přehledům společnosti InstaForex získáte plné povědomi o tržních trendech! Jako zákazníkovi společnosti InstaForex je Vám k dispozici velký počet bezplatných služeb umožňujících efektivní obchodování.


