
 Zůstat

Formace jsou grafické modely, které jsou v grafu vytvořeny podle ceny. Podle jednoho z technických postulátů se historie (cenový pohyb) opakuje. Znamená to, že pohyby cen jsou často podobné ve stejných situacích, které umožňují předvídat další vývoj situace s vysokou pravděpodobností.
Aktuální formace od společnosti InstaForex jsou snadno použitelnou službou, které vám umožňují seznámit se s nejnovějšími změnami na trhu a reagovat na na správém trhu v reálném čase. V našich službách vždy najdete nejnovější a nejrelevantnější formace na jakémkoli páru a jakémkoli časovém rámci.
was formed on 28.03 at 02:55:06 (UTC+0)
signal strength 1 of 5
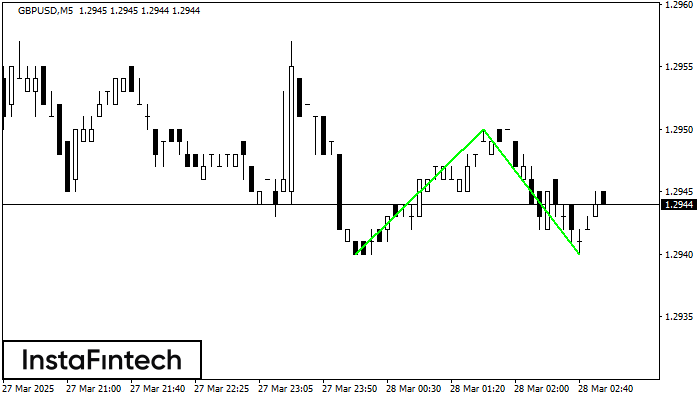
The Double Bottom pattern has been formed on GBPUSD M5. This formation signals a reversal of the trend from downwards to upwards. The signal is that a buy trade should be opened after the upper boundary of the pattern 1.2950 is broken. The further movements will rely on the width of the current pattern 10 points.
The M5 and M15 time frames may have more false entry points.
Podívejte se také na
- Vše
- Double Top
- Flag
- Head and Shoulders
- Pennant
- Rectangle
- Triangle
- Triple top
- Vše
- #AAPL
- #AMZN
- #EBAY
- #FB
- #GOOG
- #INTC
- #KO
- #MA
- #MCD
- #MSFT
- #NTDOY
- #PEP
- #TSLA
- #TWTR
- AUDCAD
- AUDCHF
- AUDJPY
- AUDUSD
- EURCAD
- EURCHF
- EURGBP
- EURJPY
- EURNZD
- EURRUB
- EURUSD
- GBPAUD
- GBPCHF
- GBPJPY
- GBPUSD
- GOLD
- NZDCAD
- NZDCHF
- NZDJPY
- NZDUSD
- SILVER
- USDCAD
- USDCHF
- USDJPY
- USDRUB
- Vše
- M5
- M15
- M30
- H1
- D1
- Buy (nákup)
- Sale (prodej)
- Vše
- Vše
- 1
- 2
- 3
- 4
- 5

Secondo il grafico di M5, GBPCHF ha formato il modello Triangolo Simmetrico Ribassista. Raccomandazioni di trading: Una rottura del confine inferiore 1.0783 rischia di incoraggiare una continuazione del trend discendente
I time frame M5 e M15 possono avere più punti di ingresso falsi.
Open chart in a new window
Il modello Triplo Minimo si è formato sul grafico M15 del USDJPY. Caratteristiche del modello: La linea inferiore del modello ha coordinate 140.99 con il confine superiore 140.99/140.92, la proiezione
I time frame M5 e M15 possono avere più punti di ingresso falsi.
Open chart in a new window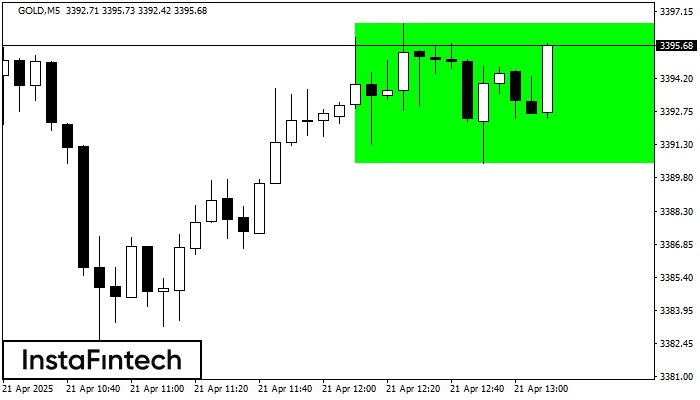
Secondo il grafico di M5, GOLD ha formato il Rettangolo Rialzista. Questo tipo di modello indica una continuazione di trend. Consiste di due livelli: resistenza 3396.64 e supporto 3390.42
I time frame M5 e M15 possono avere più punti di ingresso falsi.
Open chart in a new window


