
 Zůstat

Formace jsou grafické modely, které jsou v grafu vytvořeny podle ceny. Podle jednoho z technických postulátů se historie (cenový pohyb) opakuje. Znamená to, že pohyby cen jsou často podobné ve stejných situacích, které umožňují předvídat další vývoj situace s vysokou pravděpodobností.
Aktuální formace od společnosti InstaForex jsou snadno použitelnou službou, které vám umožňují seznámit se s nejnovějšími změnami na trhu a reagovat na na správém trhu v reálném čase. V našich službách vždy najdete nejnovější a nejrelevantnější formace na jakémkoli páru a jakémkoli časovém rámci.
was formed on 28.03 at 21:14:20 (UTC+0)
signal strength 1 of 5
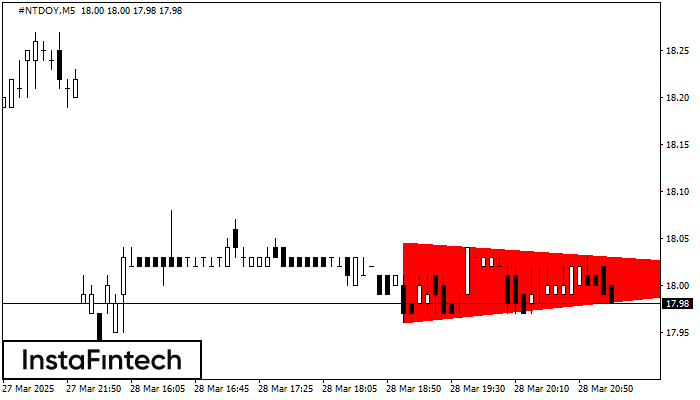
According to the chart of M5, #NTDOY formed the Bearish Symmetrical Triangle pattern. Description: The lower border is 17.96/18.01 and upper border is 18.05/18.01. The pattern width is measured on the chart at -9 pips. The formation of the Bearish Symmetrical Triangle pattern evidently signals a continuation of the downward trend. In other words, if the scenario comes true and #NTDOY breaches the lower border, the price could continue its move toward 17.86.
The M5 and M15 time frames may have more false entry points.
Podívejte se také na
- Vše
- Double Top
- Flag
- Head and Shoulders
- Pennant
- Rectangle
- Triangle
- Triple top
- Vše
- #AAPL
- #AMZN
- #EBAY
- #FB
- #GOOG
- #INTC
- #KO
- #MA
- #MCD
- #MSFT
- #NTDOY
- #PEP
- #TSLA
- #TWTR
- AUDCAD
- AUDCHF
- AUDJPY
- AUDUSD
- EURCAD
- EURCHF
- EURGBP
- EURJPY
- EURNZD
- EURRUB
- EURUSD
- GBPAUD
- GBPCHF
- GBPJPY
- GBPUSD
- GOLD
- NZDCAD
- NZDCHF
- NZDJPY
- NZDUSD
- SILVER
- USDCAD
- USDCHF
- USDJPY
- USDRUB
- Vše
- M5
- M15
- M30
- H1
- D1
- Buy (nákup)
- Sale (prodej)
- Vše
- Vše
- 1
- 2
- 3
- 4
- 5
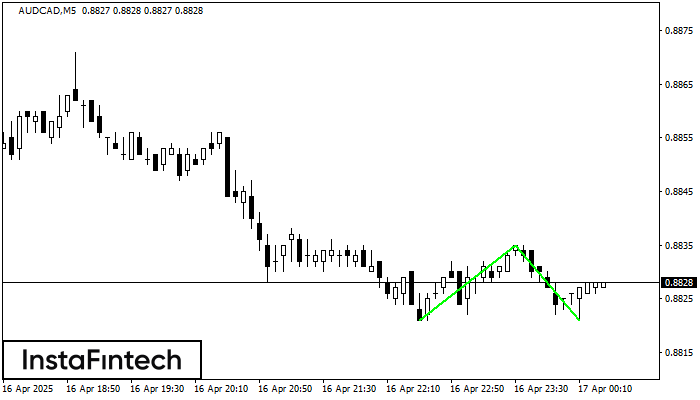
The Double Bottom pattern has been formed on AUDCAD M5; the upper boundary is 0.8835; the lower boundary is 0.8821. The width of the pattern is 14 points. In case
The M5 and M15 time frames may have more false entry points.
Open chart in a new window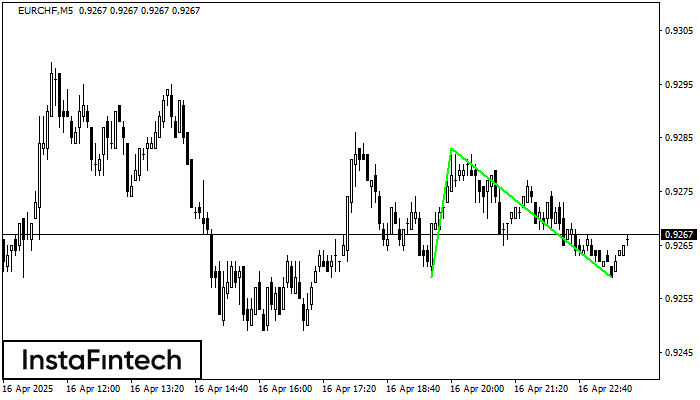
The Double Bottom pattern has been formed on EURCHF M5; the upper boundary is 0.9283; the lower boundary is 0.9259. The width of the pattern is 24 points. In case
The M5 and M15 time frames may have more false entry points.
Open chart in a new window
On the chart of #KO H1 the Double Top reversal pattern has been formed. Characteristics: the upper boundary 72.67; the lower boundary 71.72; the width of the pattern 95 points
Open chart in a new window

